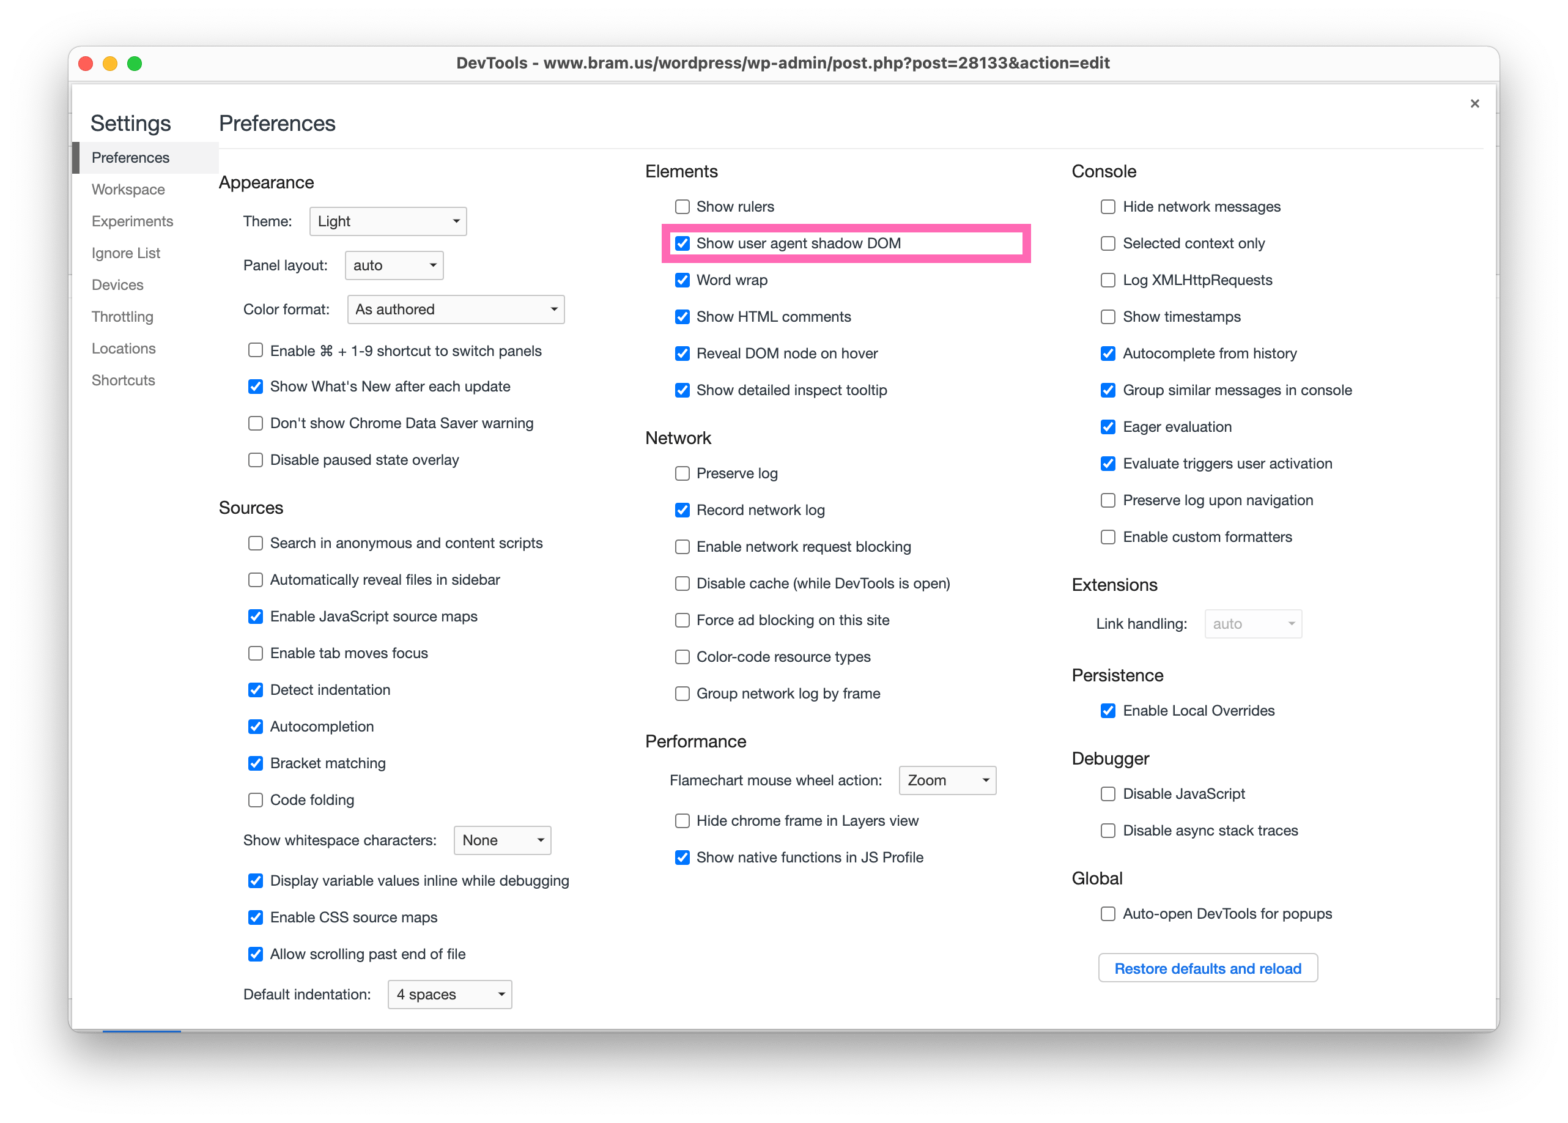
Identify and Extract Pseudo-Element Selectors from built-in HTML Elements using DevTools
A rather geeky/technical weblog, est. 2001, by Bramus
z-index stacking with the “CSS Stacking Context Inspector” DevTools extension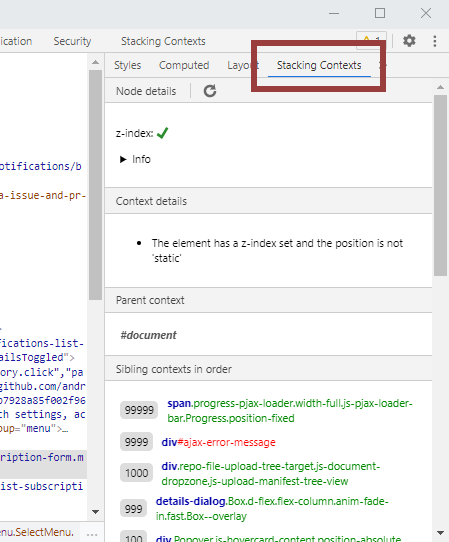
The Stacking Contexts Inspector is a DevTools extension for Google Chrome that allows you to analyse the stacking contexts available on a webpage. This extension will add a new panel to the DevTools and a new sidebar on the elements panel. Handy for when you’re having stacking issues. CSS Stacking Context Inspector →Stacking Contexts Inspector …
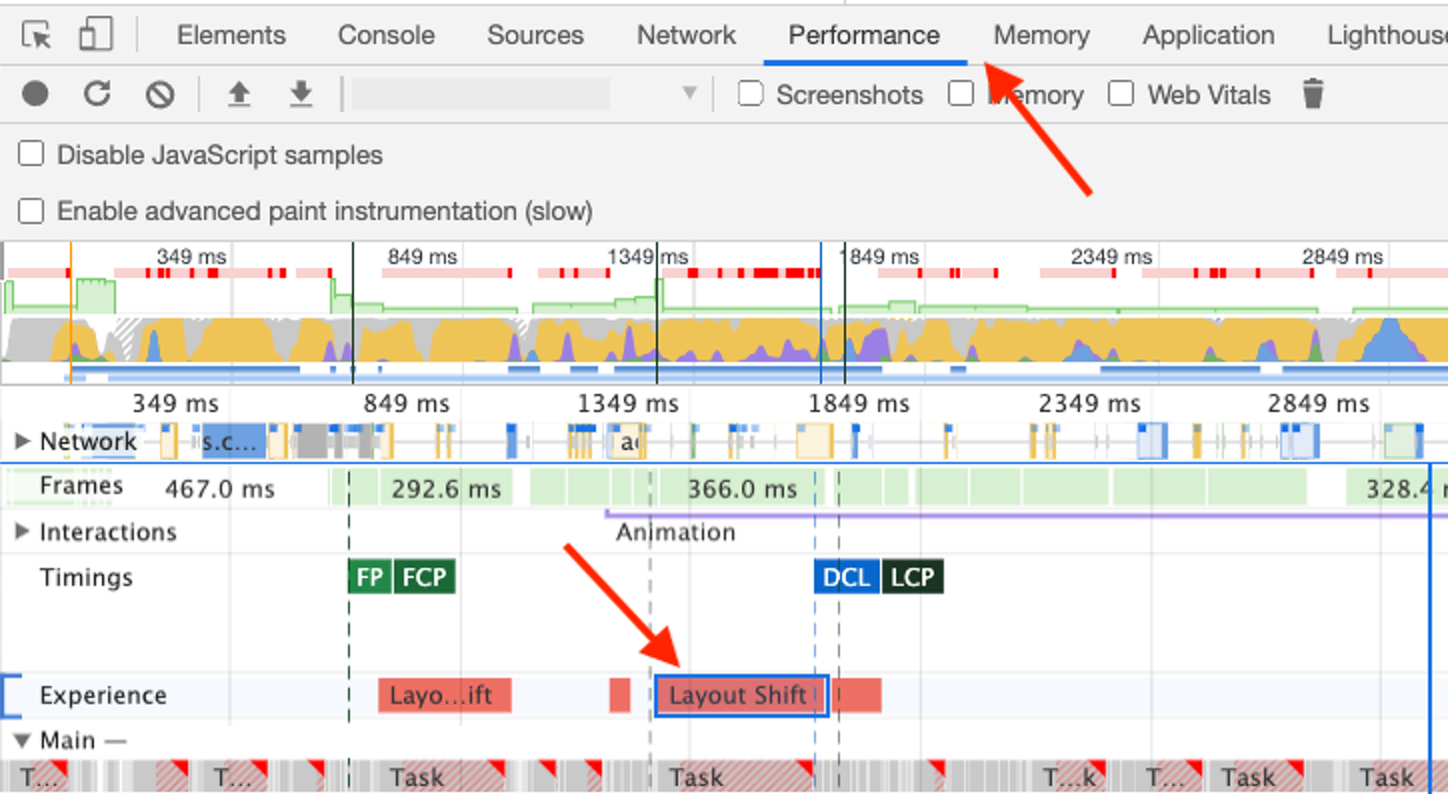
Over at web.dev, Katie Hempenius learns us how to identify and fix layout shifts using the Layout Instability API and the DevTools. What I take away from this is that you can easily spot them using DevTools: In the Rendering Panel you can enable an option to highlight areas of Layout Shift: To enable Layout …
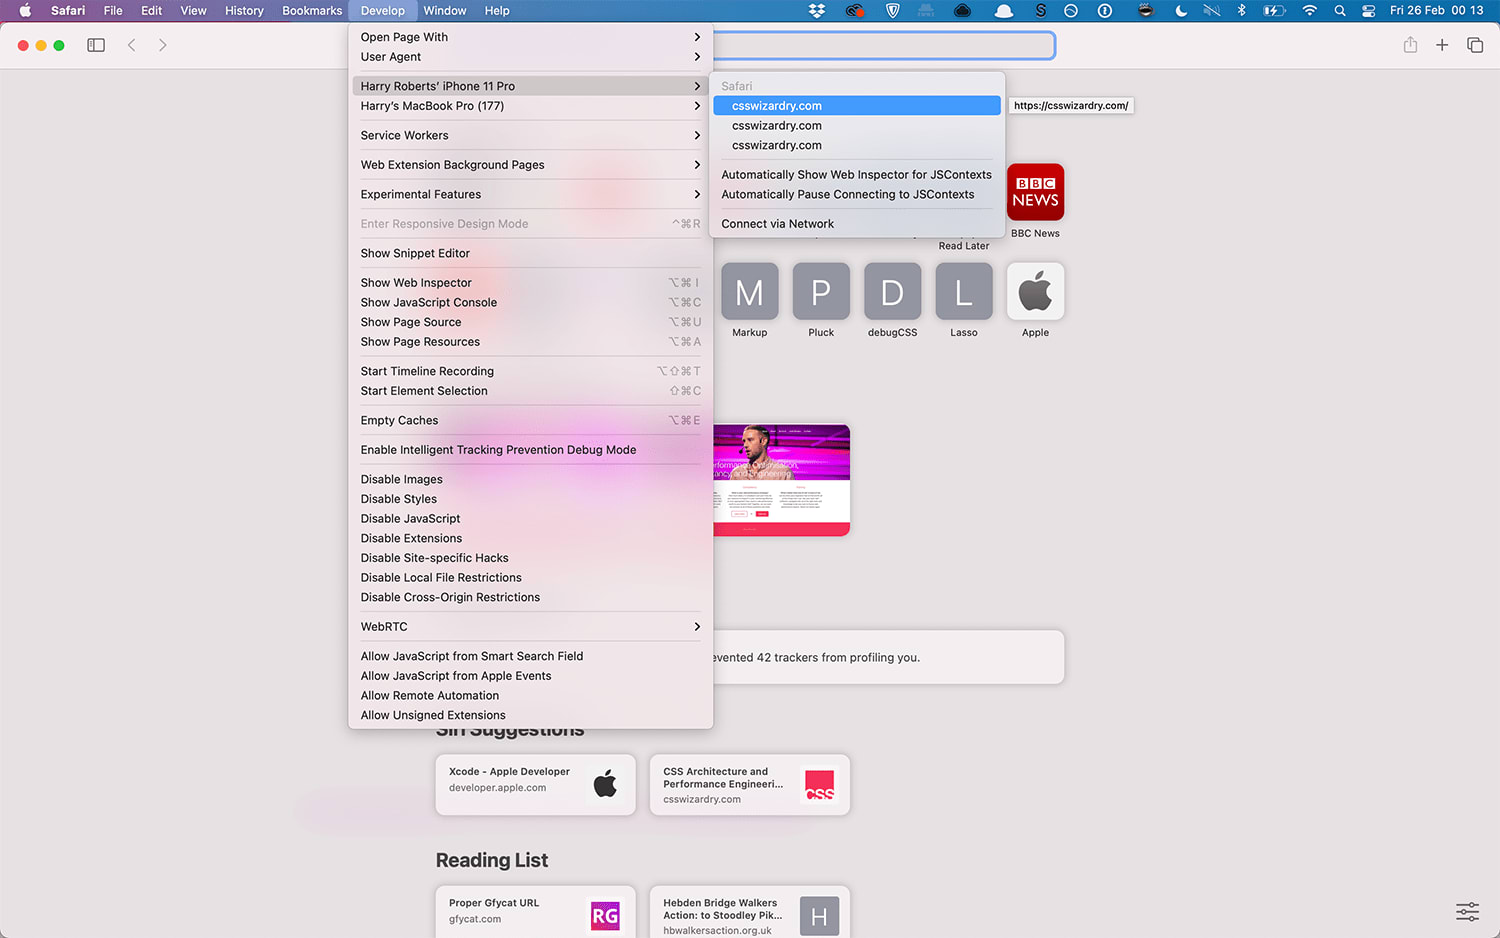
Harry Roberts explains how to inspect pages from MobileSafari (on your iDevice) using the Safari (on your Mac) DevTools. It’s been a while since I’ve done this, but if I recall correctly you can — once set up — also debug pages in MobileSafari without needing a physical USB connection. It’ll run over Bluetooth. Measuring …
Continue reading “Inspecting Safari on iPhone using the Safari (on desktop) DevTools”

I especially like the New CSS Angle Visualization Tool 🙂 What’s New In DevTools (Chrome 88) →
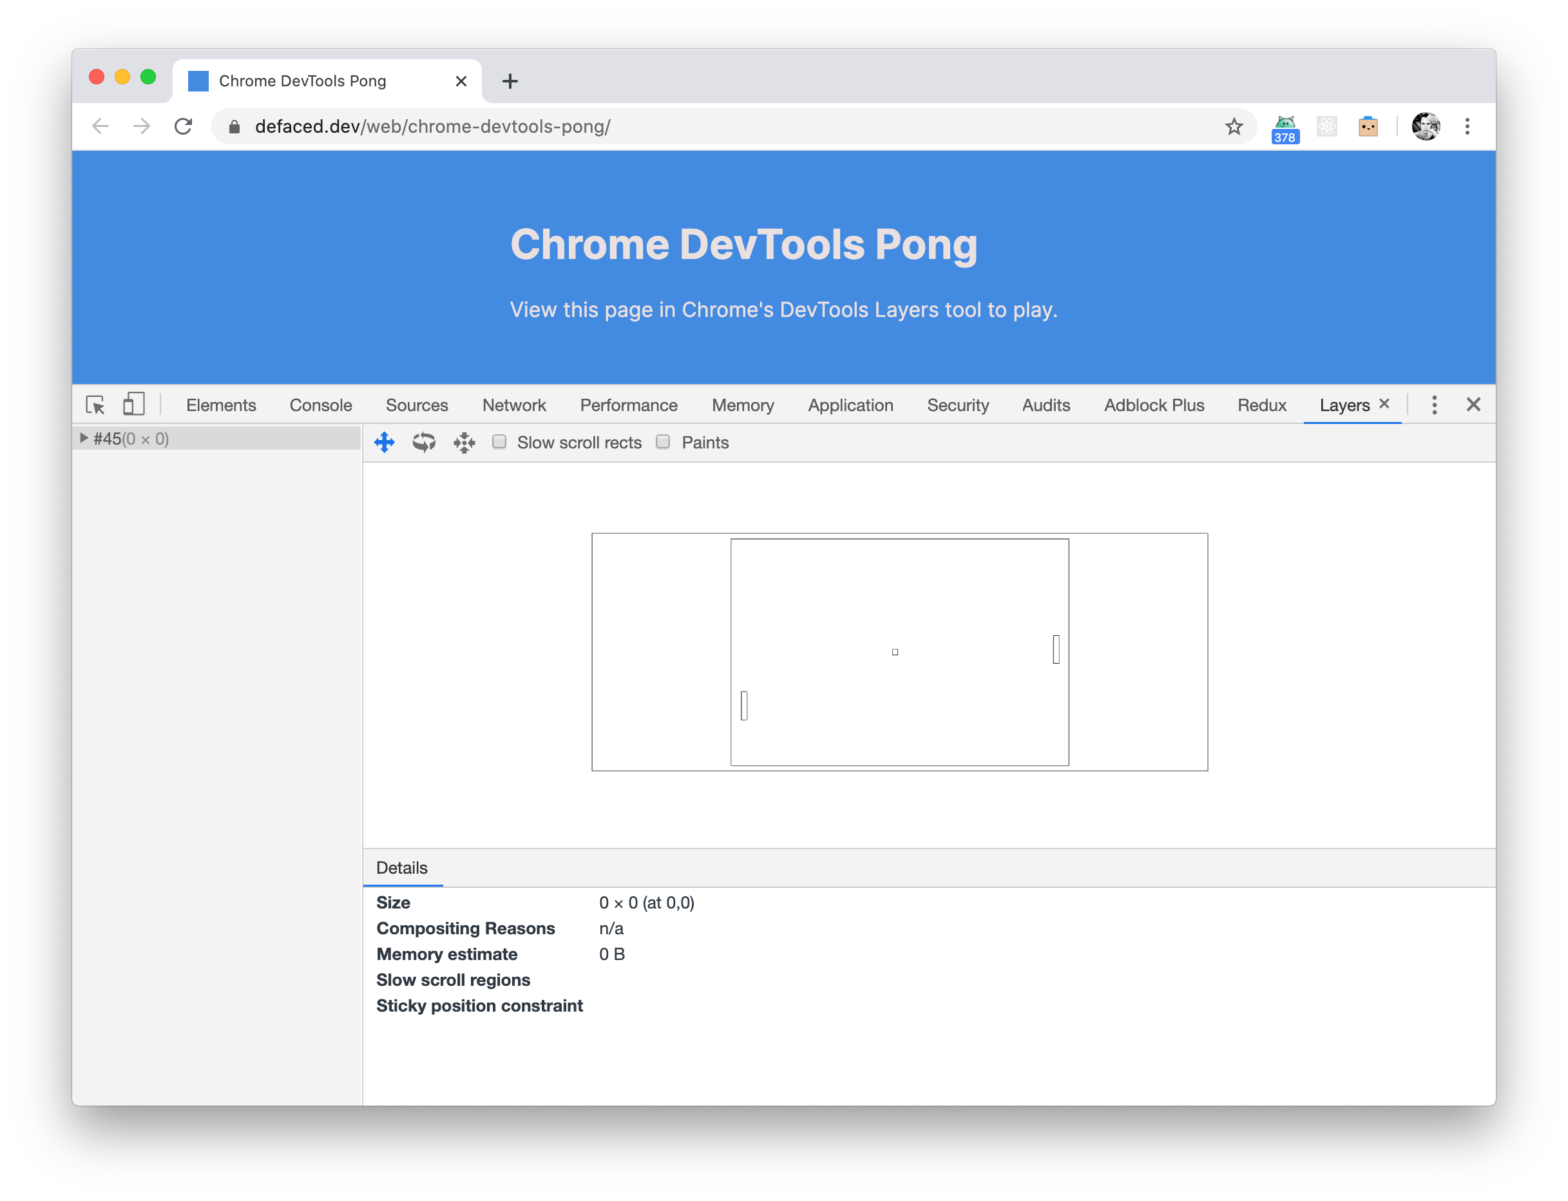
Move over Chrome Dino Game! Now you can play Pong inside the Chrome DevTools. Chrome DevTools Pong → Spoiler: How it works In case you were wondering: it’s a regular Pong game, but with the elements visually hidden (opacity: 0;) so that they only show up in the DevTools’ Layers Panel. So simple, that becomes …
Continue reading “Chrome DevTools Pong – A game to play inside the Chrome DevTools”

Reactime is a debugging tool for React developers. It records state whenever it is changed and allows the user to jump to any previously recorded state. This dev tool is for React apps using stateful components and prop drilling, and has beta support for Context API, conditional state routing, Hooks (useState, useEffect) and functional components. …
Continue reading “Reactime – A time-travel state debugger for React apps”

Coming to the next version of Chrome is a way to emulate “Dark Mode” using the DevTools. With the DevTools open and focused, hit SHIFT+CMD+P and choose “Emulate CSS prefers-color-scheme: dark” from the menu You can also access the option via the Rendering panel. (Via @ChromeDevTools)
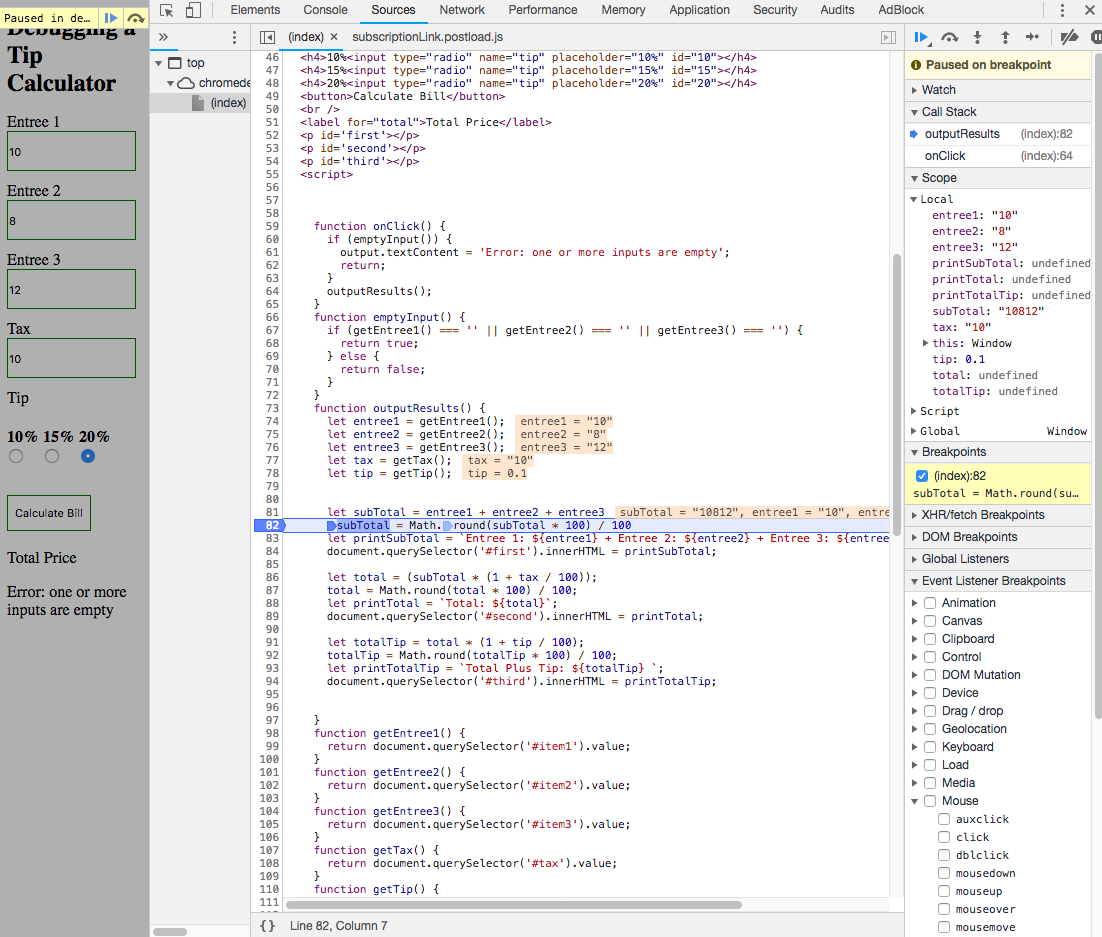
Solid introduction – with a real use case – on how to use the browsers’s built-in debugger: In this post, I will cover using breakpoints, stepping through your code, setting watch expressions, and applying your fixes in Chrome Developer Tools. How to stop using console.log() and start using your browser’s debugger → ☝️ Do not …
Continue reading “How to start using your browser’s debugger”

Dev Tools can do a lot of things. We’re are not going to dive into the nitty gritty details of each and every feature. Instead we’ll take a look at the top 10 helpful features that help us save time and write better React code. Good intro (*) on how to find your way around …
Continue reading “How to use React Dev Tools, an introduction”