NodemailerApp — Cross Platform Email Debugging Application

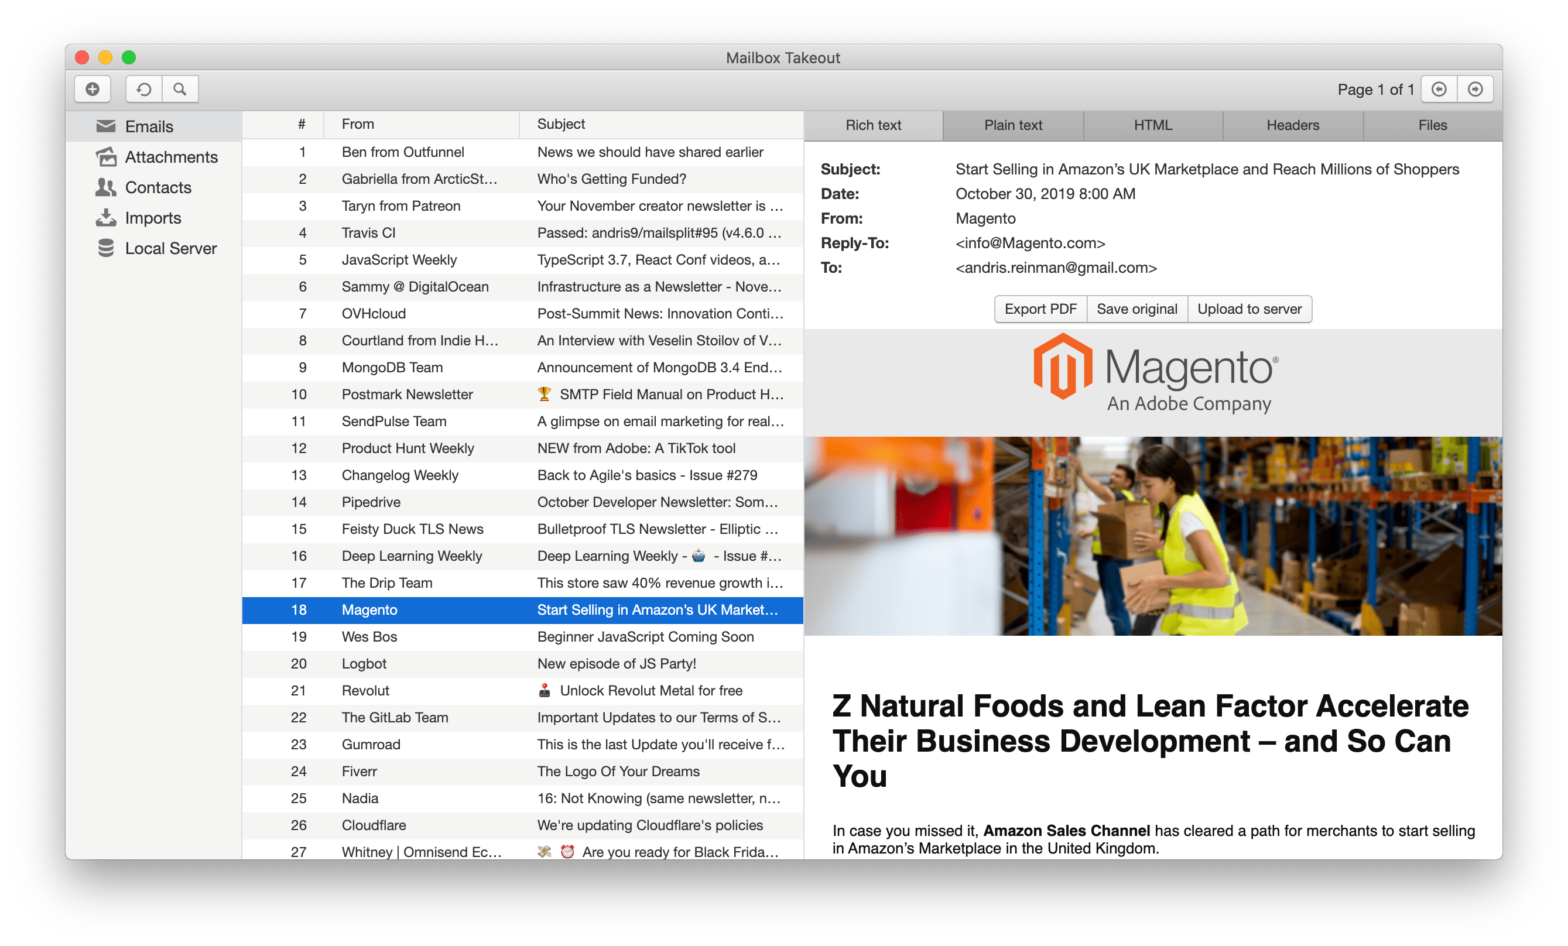
NodeMailer is a module for Node.js applications to allow easy email sending. From the same authors also comes NodemailerApp, an application created to help you debug email. NodemailerApp includes local SMTP and POP3 servers, a sendmail replacement, catchall email domain service, AMP4Email renderer […] You can use NodemailerApp to instantly preview emails sent from your …

A Guide To CSS Debugging

Over at Smashing Magazine, Stephanie Eckles has published an extensive piece on CSS Debugging. In my experience, CSS layout issues often fall out of one of the following categories: Overflow of content from its parent resulting in extra or unexpected scrollbars and content being pushed out of the regular viewport area. Inheriting browser inconsistencies leading …

Ray – Dump Debugging Evolved

The folks over at Spatie have released a new tool called Ray that helps you with debugging. Ray is a beautiful, lightweight desktop app that helps you debug your app. After installing one of the libraries to send information to Ray, you can use the ray() function to quickly dump stuff. Any variable(s) that you …

Reactime – A time-travel state debugger for React apps

Reactime is a debugging tool for React developers. It records state whenever it is changed and allows the user to jump to any previously recorded state. This dev tool is for React apps using stateful components and prop drilling, and has beta support for Context API, conditional state routing, Hooks (useState, useEffect) and functional components. …

How to start using your browser’s debugger

Solid introduction – with a real use case – on how to use the browsers’s built-in debugger: In this post, I will cover using breakpoints, stepping through your code, setting watch expressions, and applying your fixes in Chrome Developer Tools. How to stop using console.log() and start using your browser’s debugger → ☝️ Do not …

How to use React Dev Tools, an introduction

Dev Tools can do a lot of things. We’re are not going to dive into the nitty gritty details of each and every feature. Instead we’ll take a look at the top 10 helpful features that help us save time and write better React code. Good intro (*) on how to find your way around …

Exceptional Exceptions: Cleverly throwing Exceptions in PHP

TIL, from the Engagor Clarabridge Development Blog: When creating an \Exception in PHP (including your own extended classes), you can pass in a third argument named $previous. It defines the previous \Exception used for exception chaining, leaving you with better errors for debugging: try { $this->doSomeImportantStuffWith($foo); } catch (VeryDescriptiveException $e) { // do some stuff …

LogRocket: Logging and Session Replay for JavaScript Apps

LogRocket is a front-end logging tool that lets you replay problems as if they happened in your own browser. Instead of guessing why errors happen, or asking users for screenshots and log dumps, LogRocket lets you replay the session to quickly understand what went wrong. It works perfectly with any app, regardless of framework, and …

Debugging Node.js using the Chrome DevTools

With Chrome 57+, the Node.js debugging feature is enabled by default. To start debugging, run your Node.js application [using Node 6.4+] with the –inspect flag. Like so: $ node –inspect <your_file>.js Open the outputted URL or visit chrome://inspect/ to open dedicated DevTools for Node to start debugging 🙂 Debugging Node.js with Google Chrome →