How to start using your browser’s debugger

Solid introduction – with a real use case – on how to use the browsers’s built-in debugger:

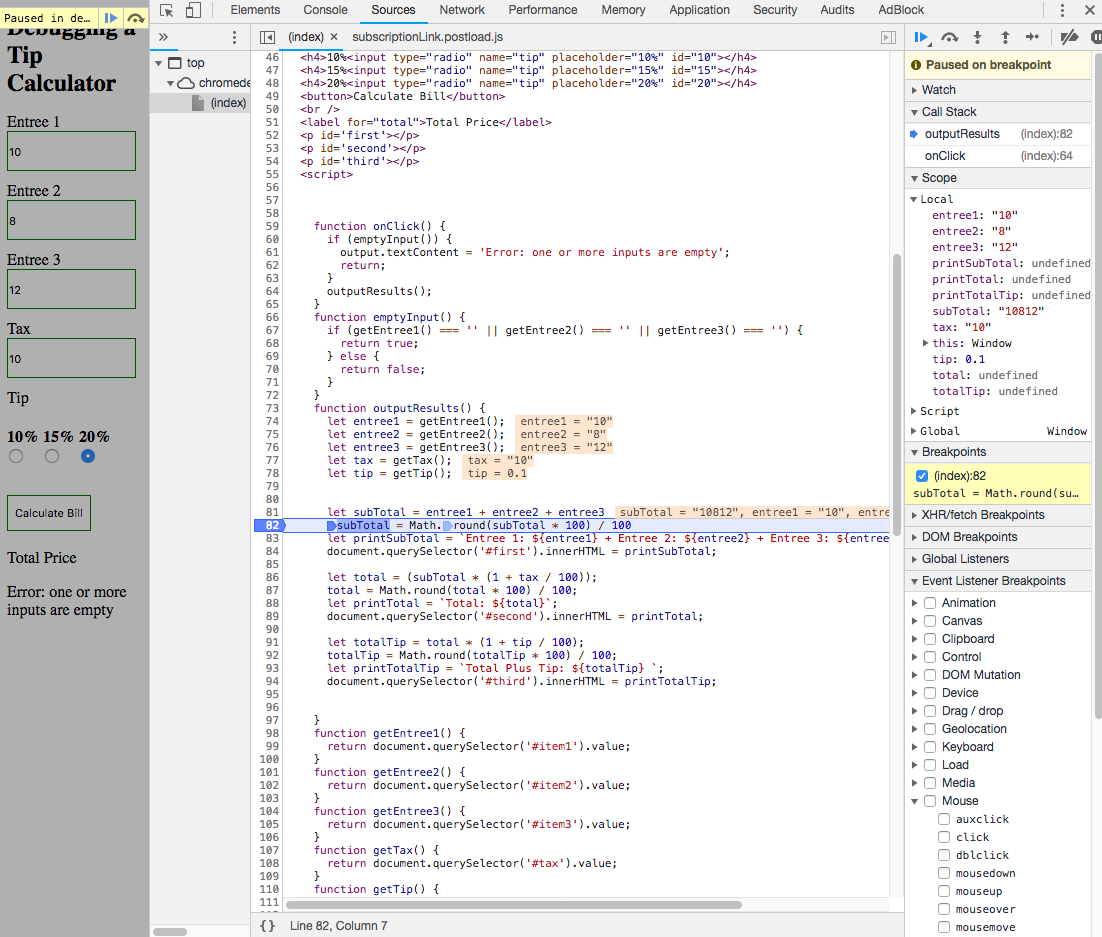
In this post, I will cover using breakpoints, stepping through your code, setting watch expressions, and applying your fixes in Chrome Developer Tools.

How to stop using console.log() and start using your browser’s debugger →

☝️ Do not confuse the debugger with extra console.… methods such as console.table(), something which you can read about here.

Published by Bramus!

Bramus is a frontend web developer from Belgium, working as a Chrome Developer Relations Engineer at Google. From the moment he discovered view-source at the age of 14 (way back in 1997), he fell in love with the web and has been tinkering with it ever since (more …)

Leave a comment

Your email address will not be published. Required fields are marked *

This site uses Akismet to reduce spam. Learn how your comment data is processed.