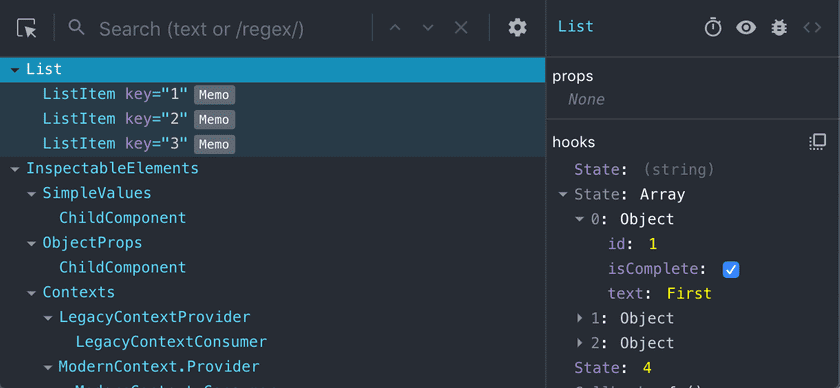
Enabling experimental Developer Tools Experiments

Using chrome://flags/ it’s possible to enable “Developer Tools Experiments”. On the most recent Fronteers Conference, Umar Hansa showed that there are even more DevTools Experiments that one can enable: Enable “Developer Tools Experiments” via chrome://flags/ if you haven’t already In the DevTools, go to Settings and select Experiments Hit SHIFT 6 times After having done …

Using DevTools Features Without Opening DevTools using Puppeteer

Keeping a feature of the Chrome Devtools – such as the FPS Meter – running with the DevTools closed unfortunately is not possible (yet?). Kayce Basques provides us with a little workaround though: You can hack together a Puppeteer script that launches Chromium, opens a remote debugging client, then turns on the DevTools feature that …

Inspecting Redux Stores in Production, without the Redux Devtools

Checking out the Redux Store of Soundcloud Redux Back in the day I learnt a lot by hitting CTRL+U (View Source) on websites. Nowadays I still check the source code of some apps, yet it’s become a tad more difficult for some specific things. When it comes to React apps that use Redux I like …

Chrome DevTools: Better JavaScript logging with the Log Management UI

Great explanation by Umar Hansa on the upcoming Log Management UI in the Chrome DevTools: The new Log Management UI is an experimental feature in Canary DevTools. Once enabled, you can create console.log functions which have their own context. One can create new logging contexts using console.context(name): const thirdPartyLogger = console.context(‘3rd Party’); const infoLogger = …

Chrome DevTools’ Command Menu

Something I learnt via Umar Hansa‘s great DevTools Tips is that the Chrome DevTools sport a Command Menu. By hitting SHIFT+CMD+P (same shortcut as Sublime Text’s command menu BTW) you can open it. Thanks to fuzzy matching you can easily access things in it. Chrome DevTools: UI: Command Menu → Umar Hansa’s Twitter Account is …

Debugging Node.js using the Chrome DevTools

With Chrome 57+, the Node.js debugging feature is enabled by default. To start debugging, run your Node.js application [using Node 6.4+] with the –inspect flag. Like so: $ node –inspect <your_file>.js Open the outputted URL or visit chrome://inspect/ to open dedicated DevTools for Node to start debugging 🙂 Debugging Node.js with Google Chrome →

Using react-devtools with React Native

The “React Developer Tools” is a very handy browser extension which lets inspect and manipulate the React component hierarchy along with their props and state. There’s also a standalone version, to be used with React Native. To use it, install it as a project dependency: npm install –save-dev react-devtools And then adjust the scripts section …