I built something that I needed into DevTools: debugging support for CSS @starting-style rules.
A rather geeky/technical weblog, est. 2001, by Bramus
I built something that I needed into DevTools: debugging support for CSS @starting-style rules.

The animations track of a performance trace can now tell you why an animation was not composited.
@property improvements in Chrome DevTools (Chrome 118)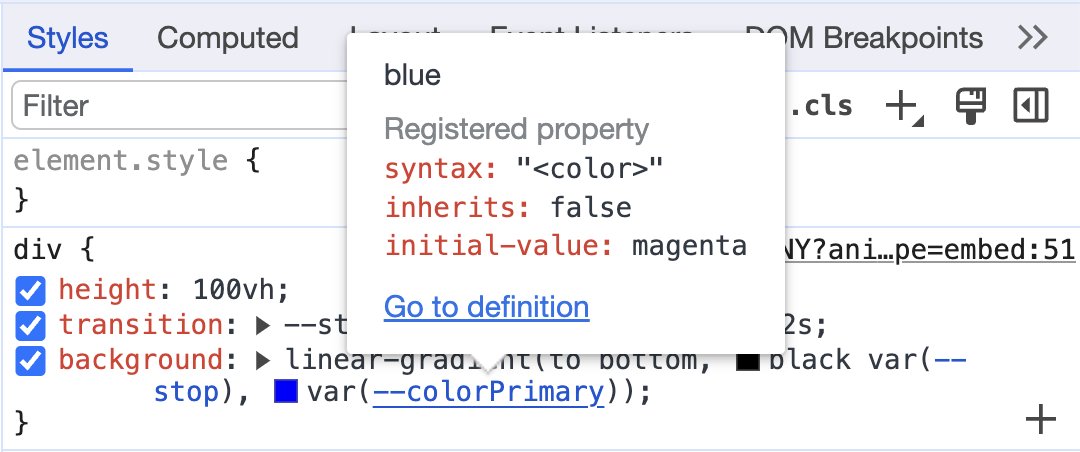
Chrome DevTools included with Chrome 118 has some nice improvements to working with @property.
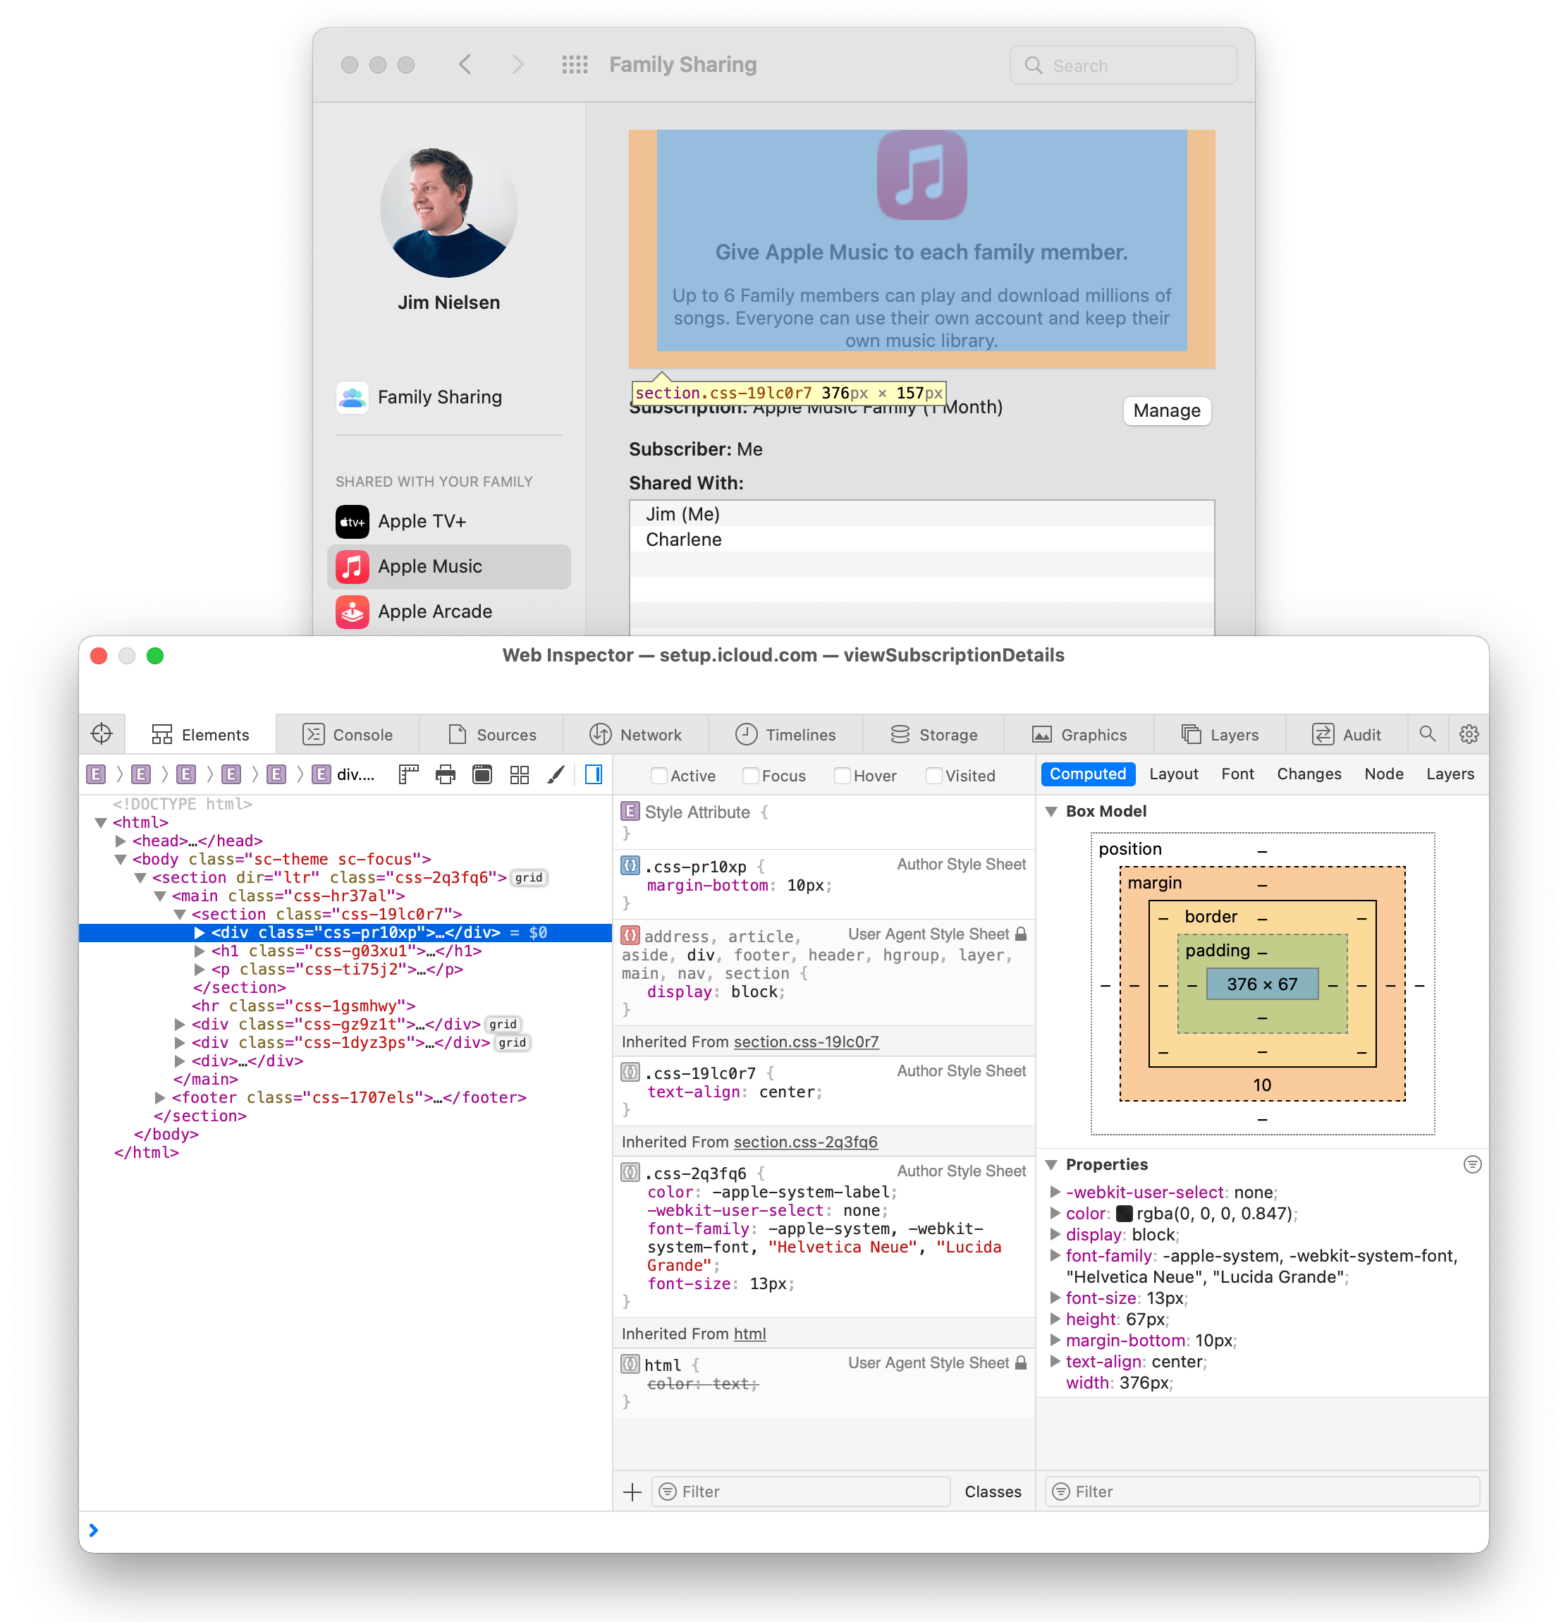
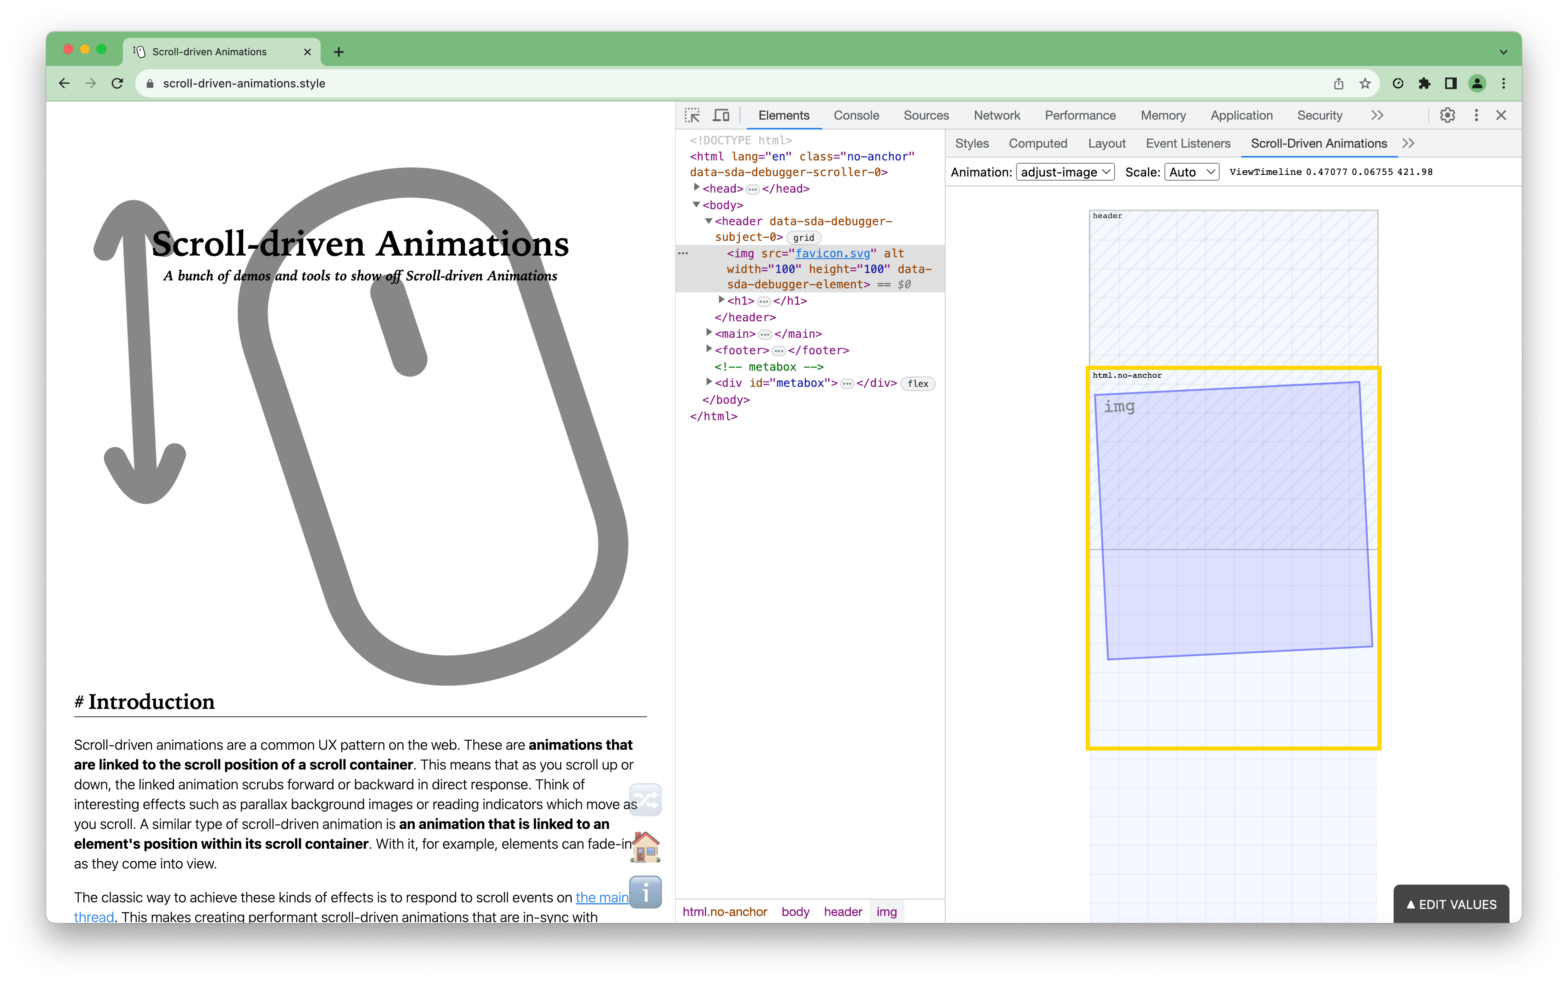
Some parts of the UI in macOS are powered by the web. Jim Nielsen shares how you can inspect these using Safari’s Web Inspector Inspecting Web Views in macOS →
console.image()
One of the things you can do on the DevTools’s Console is style the output for console.log() and the like: console.log(“%cMy stylish message”, “color: yellow; font-style: italic; background-color: blue;padding: 2px”); Leveraging this technique, it’s possible to log images to the console: Load the image via JS and extract its dimensions Expand the box of the …
Continue reading “Log images to the DevTools Console with console.image()“
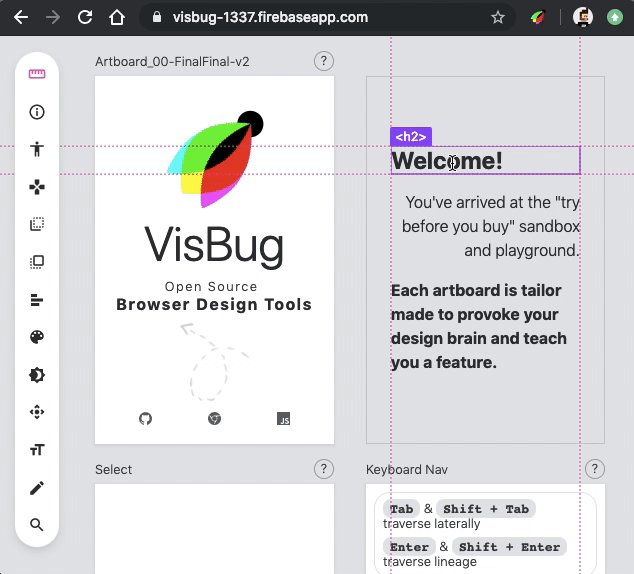
Speaking of alternative in-browser DevTools in the previous post: be sure to also check out VisBug, created by Adam Give power to designers & content creators power within the web project they have today, by bringing design tool interactions to the browser. Here’s Adam presenting it at Chrome Dev Summit 2018: You can try it …
Continue reading “VisBug — Open source browser design tools”
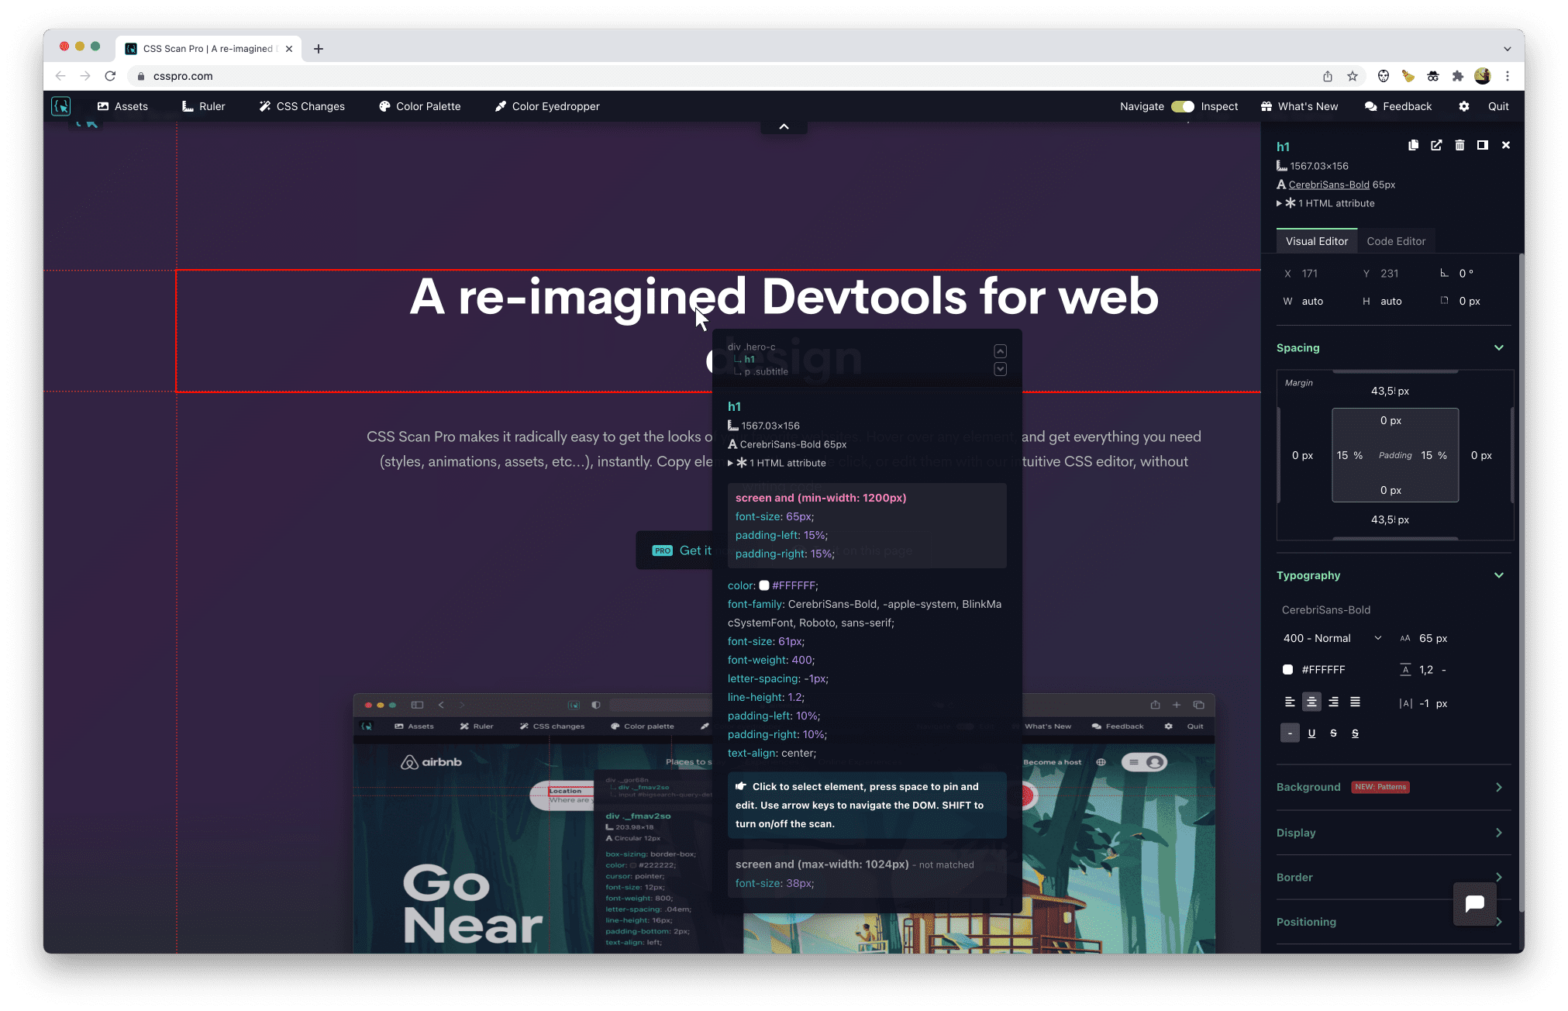
Guilherme Rizzo has been busy creating CSS Scan Pro, a re-imagined DevTools CSS Scan Pro makes it radically easy to get the looks of your favorite websites. Hover over any element, and get everything you need (styles, animations, assets, etc…), instantly. Copy elements with a single click, or edit them with our intuitive CSS editor, …
Continue reading “CSS Scan Pro — A re-imagined DevTools for web design”

If Tailwind is your thing, the “DevTools for Tailwind” by the folks over at BeyondCode looks like a handy tool to have. The DevTools for Tailwind CSS bring back designing and debugging in your browser. You can use the full power of the JIT engine and even add classes like border-[30px] on sites that use …

Pete LePage has all the details about what’s new for developers in Chrome 97: Chrome 97 is rolling out now! There’s a new option for sending real-time messages between the client and server using Web Transport. You can use feature detection to see what types of scripts a browser supports. JavaScript gets better, and there’s …
Continue reading “What’s new in Chrome 97 (Features + DevTools)”