Customise the React Native Developer Menu with Dev Settings API

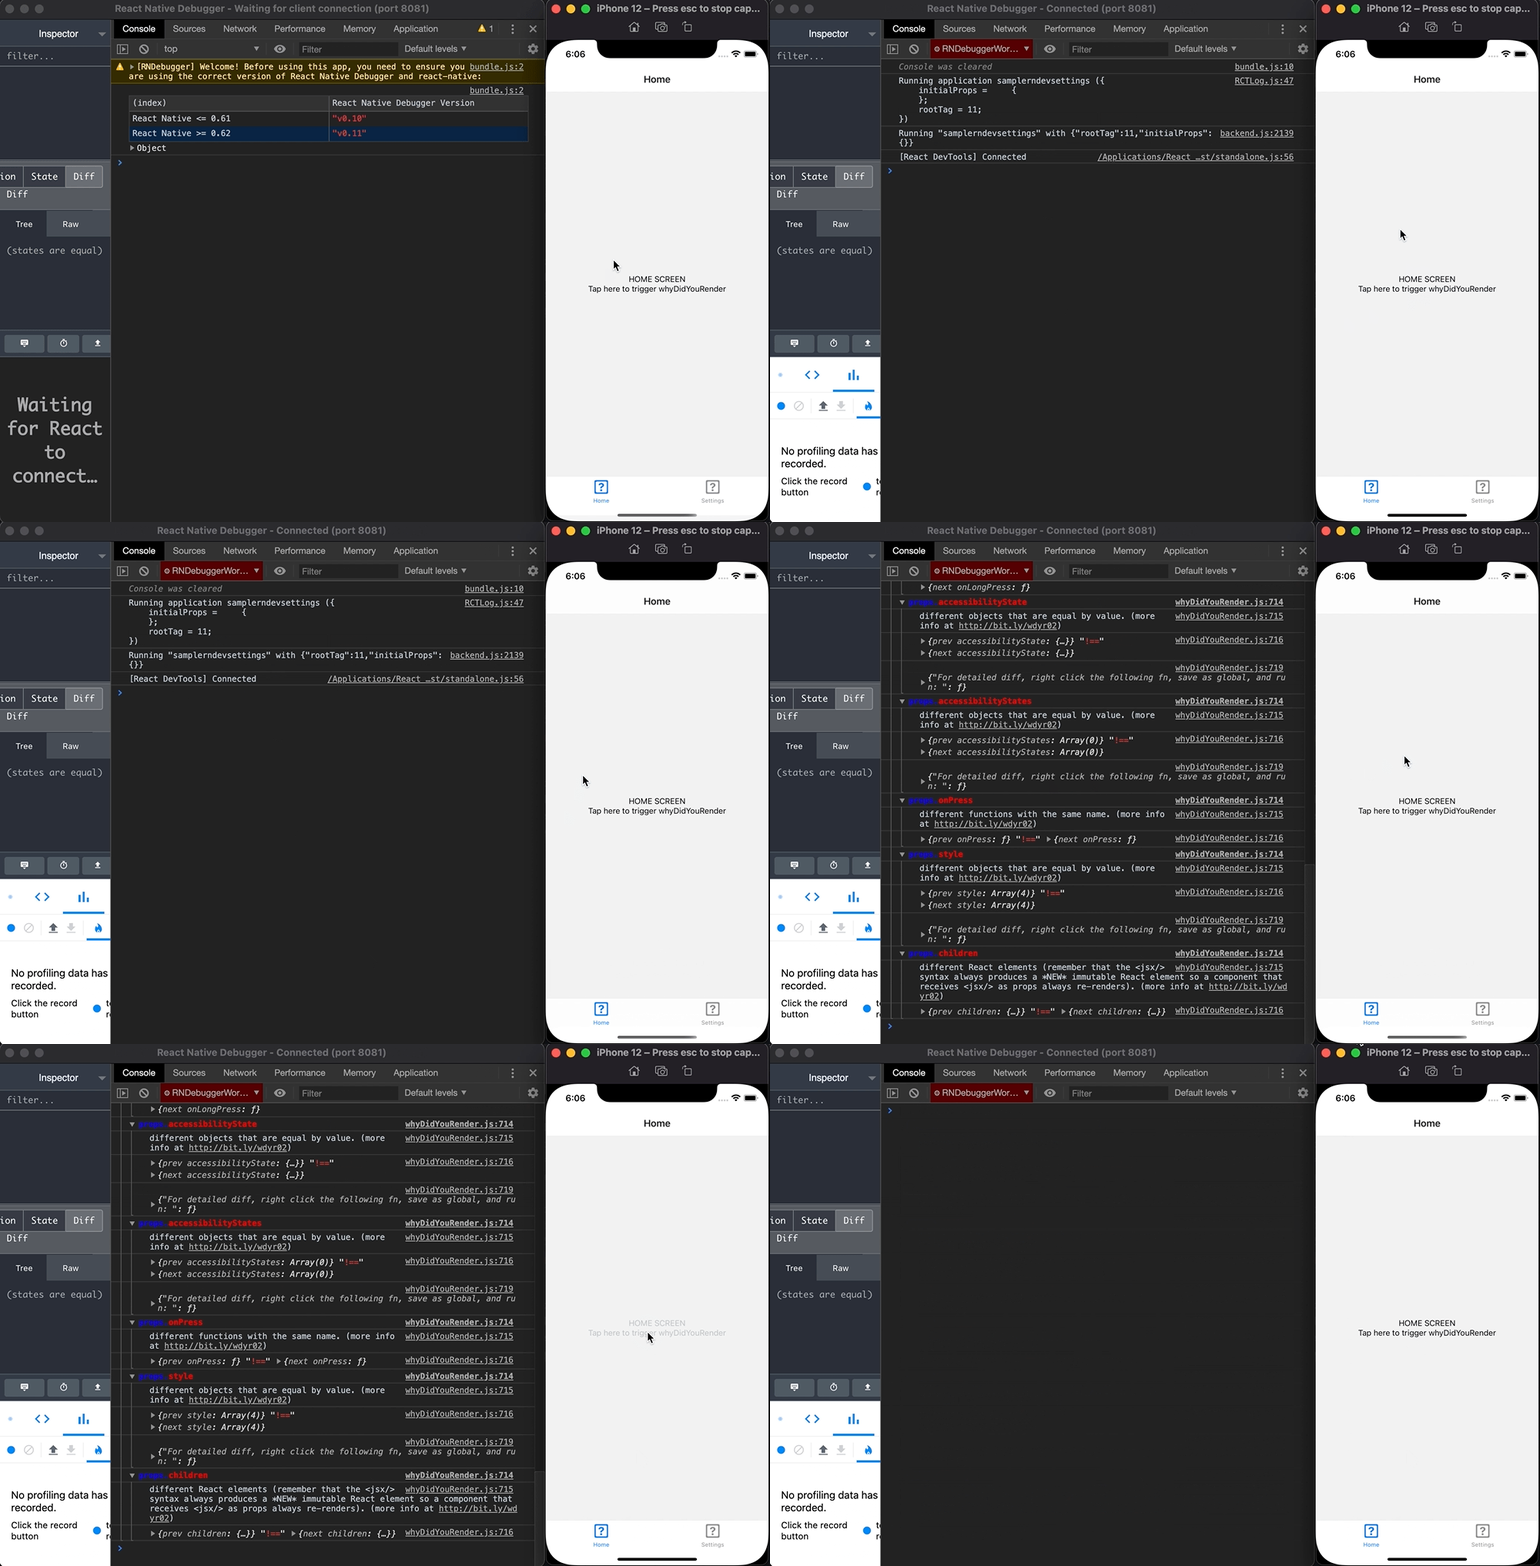
Azim Ahmed comes with a few practical code snippets to alter the React Native Developer Menu from within your code, via the DevSettings Module: Toggle why-did-you-render Perform an action on the current route import {DevSettings} from 'react-native'; import React, {useEffect, useState} from 'react'; if (process.env.NODE_ENV === 'development') { const whyDidYouRender = require('@welldone-software/why-did-you-render'); whyDidYouRender(React, {trackAllPureComponents: false}); …

DOM Treemap DevTools Extension

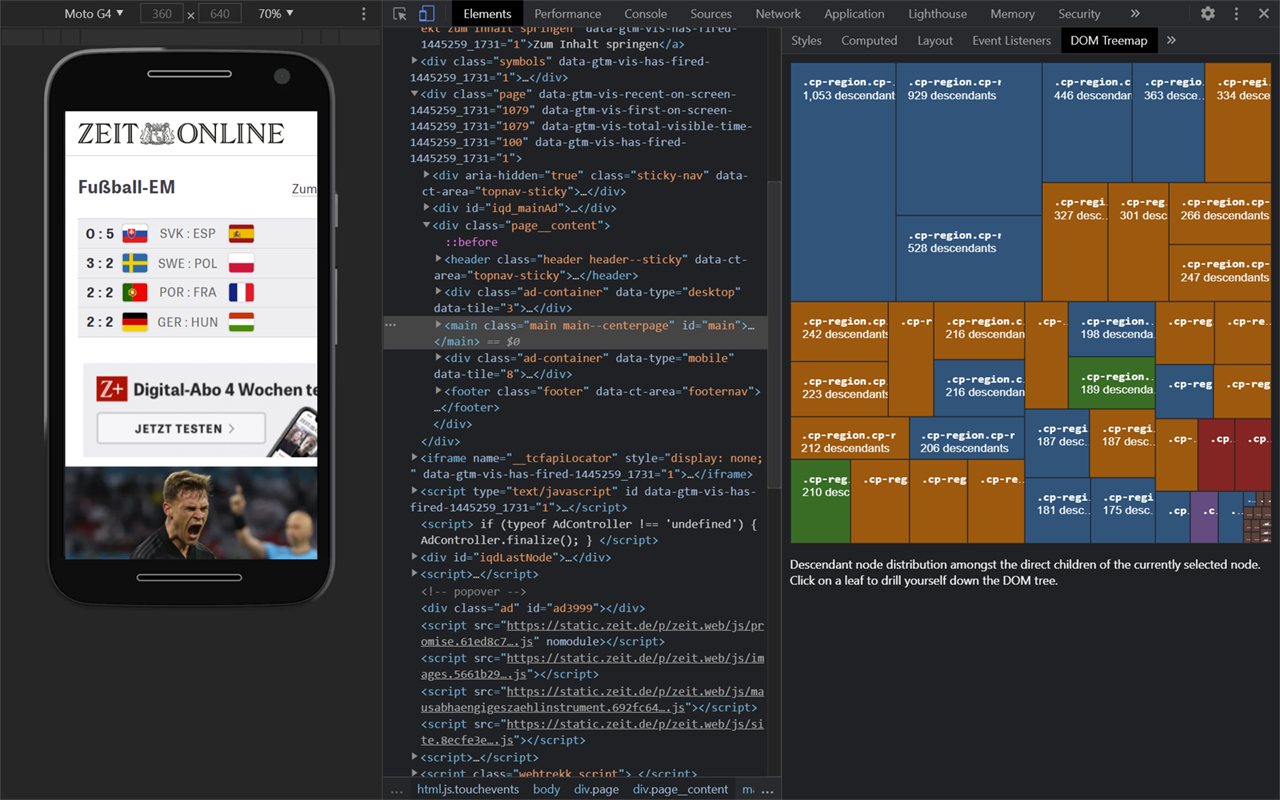
Christian Schaefer created a DevTools Extension for both Chromium and Firefox that visualizes the children of a DOM Node. The bigger the box, the more children that child node has. After a Google Lighthouse audit complaining an excessive DOM size, have you ever wondered in which corner of your document most DOM nodes are buried? …

A Guide To CSS Debugging

Over at Smashing Magazine, Stephanie Eckles has published an extensive piece on CSS Debugging. In my experience, CSS layout issues often fall out of one of the following categories: Overflow of content from its parent resulting in extra or unexpected scrollbars and content being pushed out of the regular viewport area. Inheriting browser inconsistencies leading …

CSS Shape Path Editor extension for Chrome DevTools

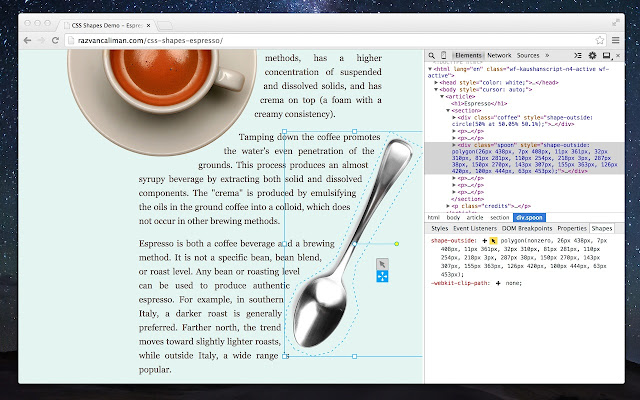
The Firefox DevTools come with a built-in editor to manipulate CSS Shapes, as demonstrated by Miriam Suzanne in the video below. For the Chromium-based browsers (Google Chrome, Microsoft Edge, …) the DevTools currently sport no such thing. Thankfully there’s an extension that can provide it for us. Once installed you’ll get an extra Shapes panel …

“Web Component DevTools” extension for Chrome DevTools

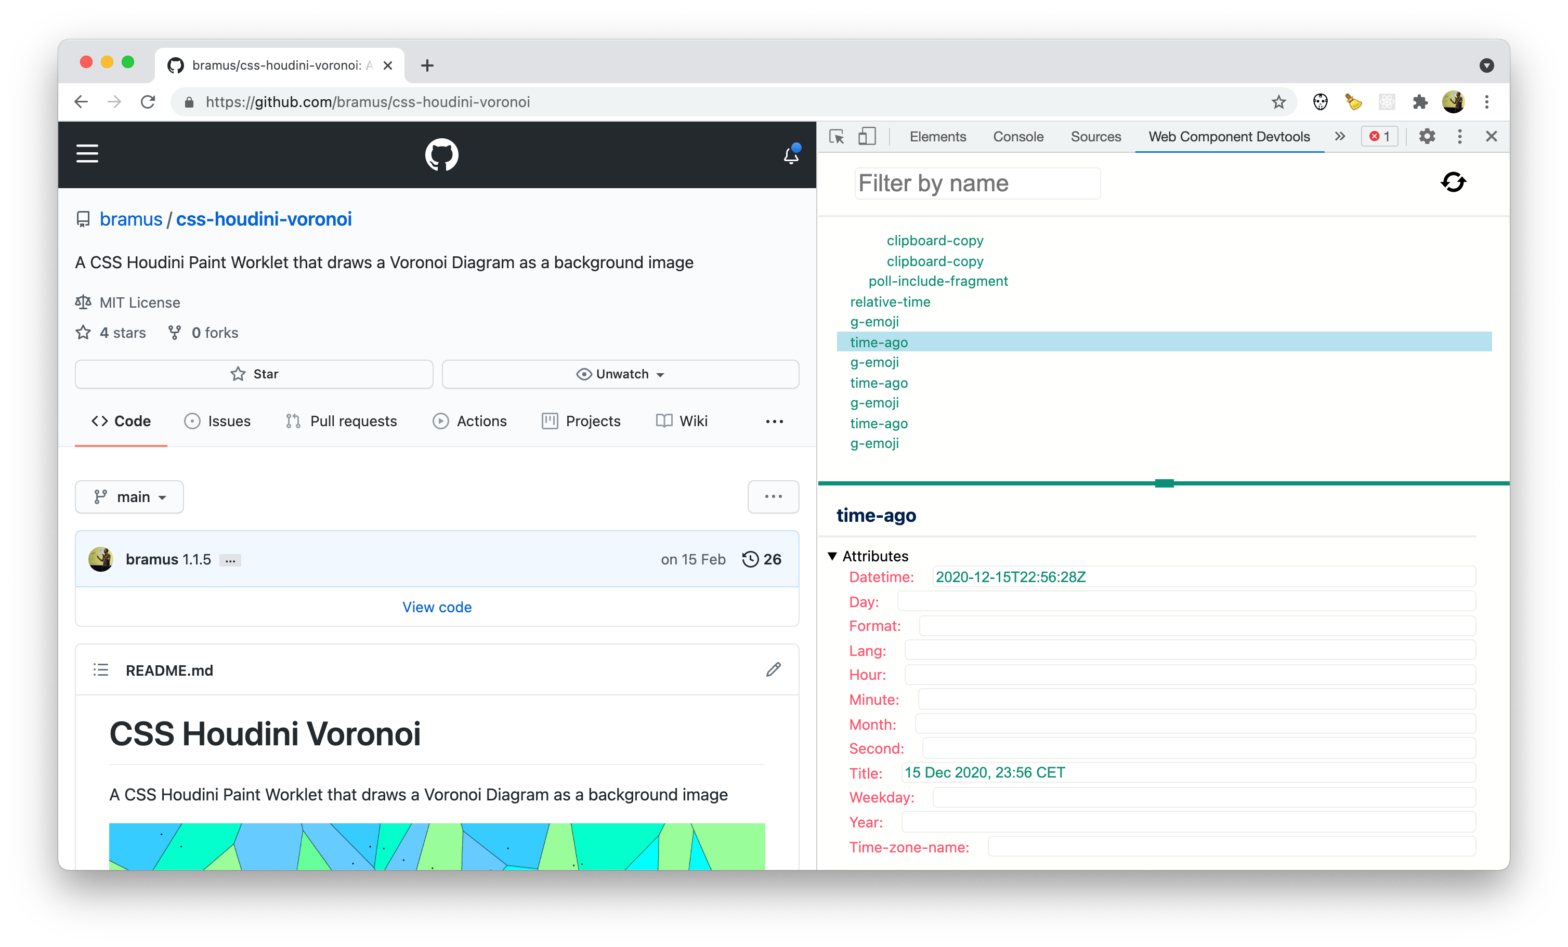
“Web Component DevTools” is a Chrome Extension for Chrome DevTools that adds support for Web Components / Custom Elements. Web Component DevTools is aimed at all developers working with Web Components. The tooling provided creates a new Chrome Devtools panel, which allows a quick look at the custom elements on the current page, and enables …

Chrome 92 — What’s New In DevTools

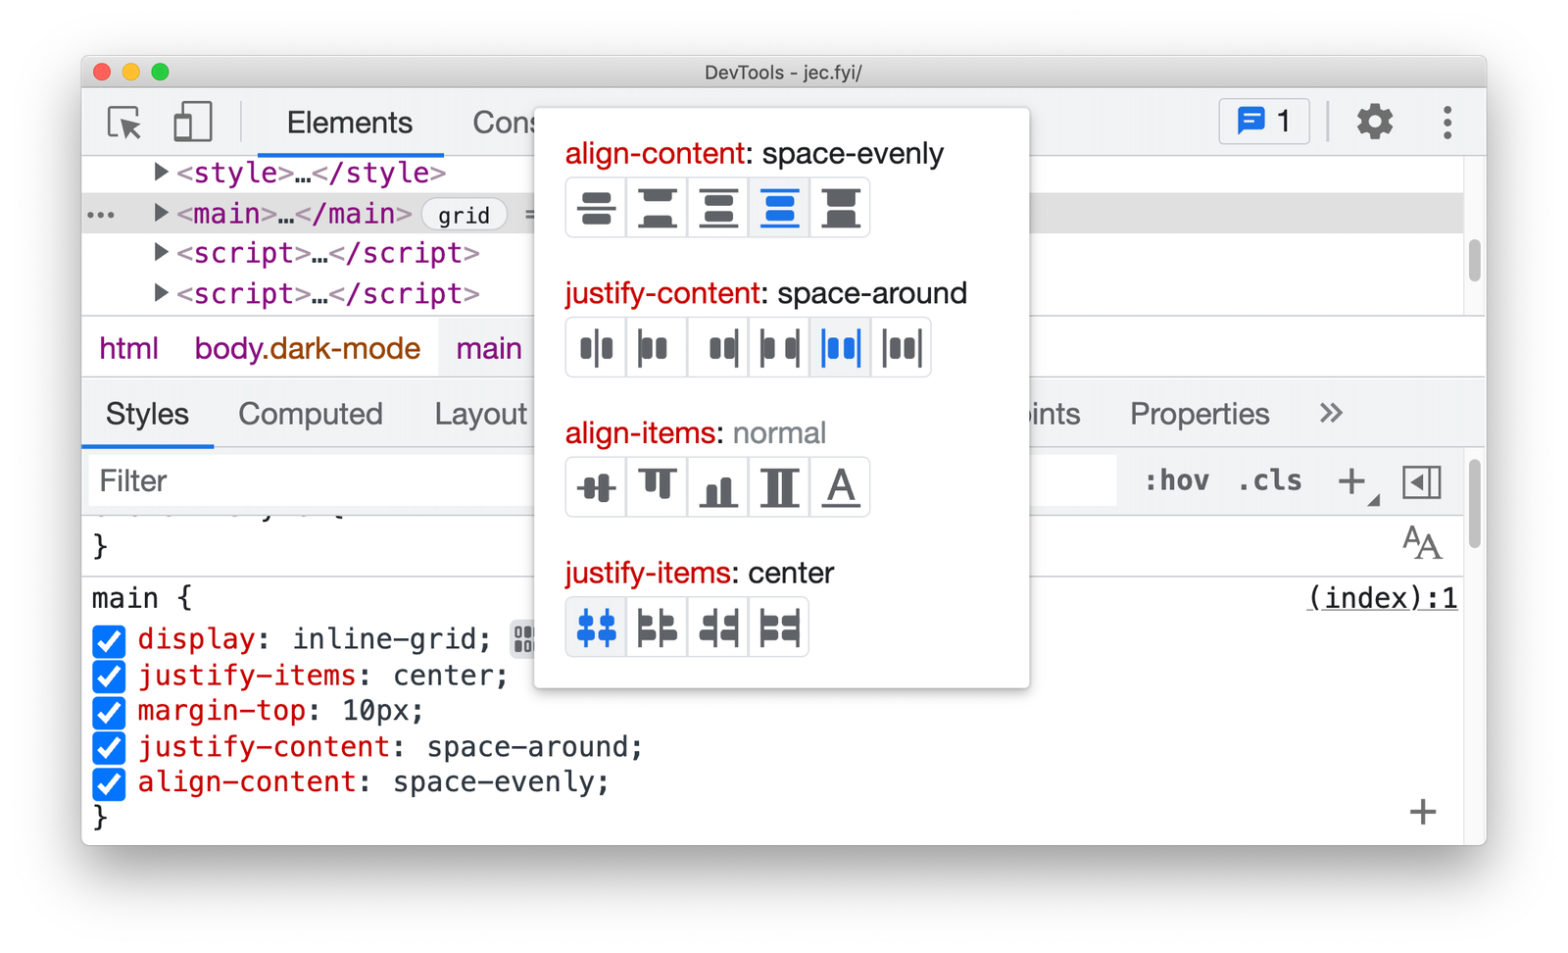
New in DevTools that ship with Chrome 92 (selection): A new CSS grid editor (pictured above), similar to the Flexbox editor which shipped with DevTools in Chrome 90 Support for const redeclarations in the Console — Oh, didn’t know I needed this! Source order viewer Enhanced CORS debugging support Lighthouse 7.5 [Experimental] Protocol monitor — …

Identify and Extract Pseudo-Element Selectors from built-in HTML Elements using DevTools

Recently Stefan Judis shared how to style the browse button of a file selector using the ::file-selector-button pseudo-element TIL – you can style the file input "browse" button using `::file-selector-button`.😲Supported in Firefox, Chromiums starting with 89 & Safari Tech preview.🔗 MDN: https://t.co/56jACY9qK1🔗 Compat data pr: https://t.co/vrFNS4LdISVideo alt: Example of a styled browse button. pic.twitter.com/3YQ0njkX0J— Stefan …

Debug/Inspect z-index stacking with the “CSS Stacking Context Inspector” DevTools extension

The Stacking Contexts Inspector is a DevTools extension for Google Chrome that allows you to analyse the stacking contexts available on a webpage. This extension will add a new panel to the DevTools and a new sidebar on the elements panel. Handy for when you’re having stacking issues. CSS Stacking Context Inspector →Stacking Contexts Inspector …