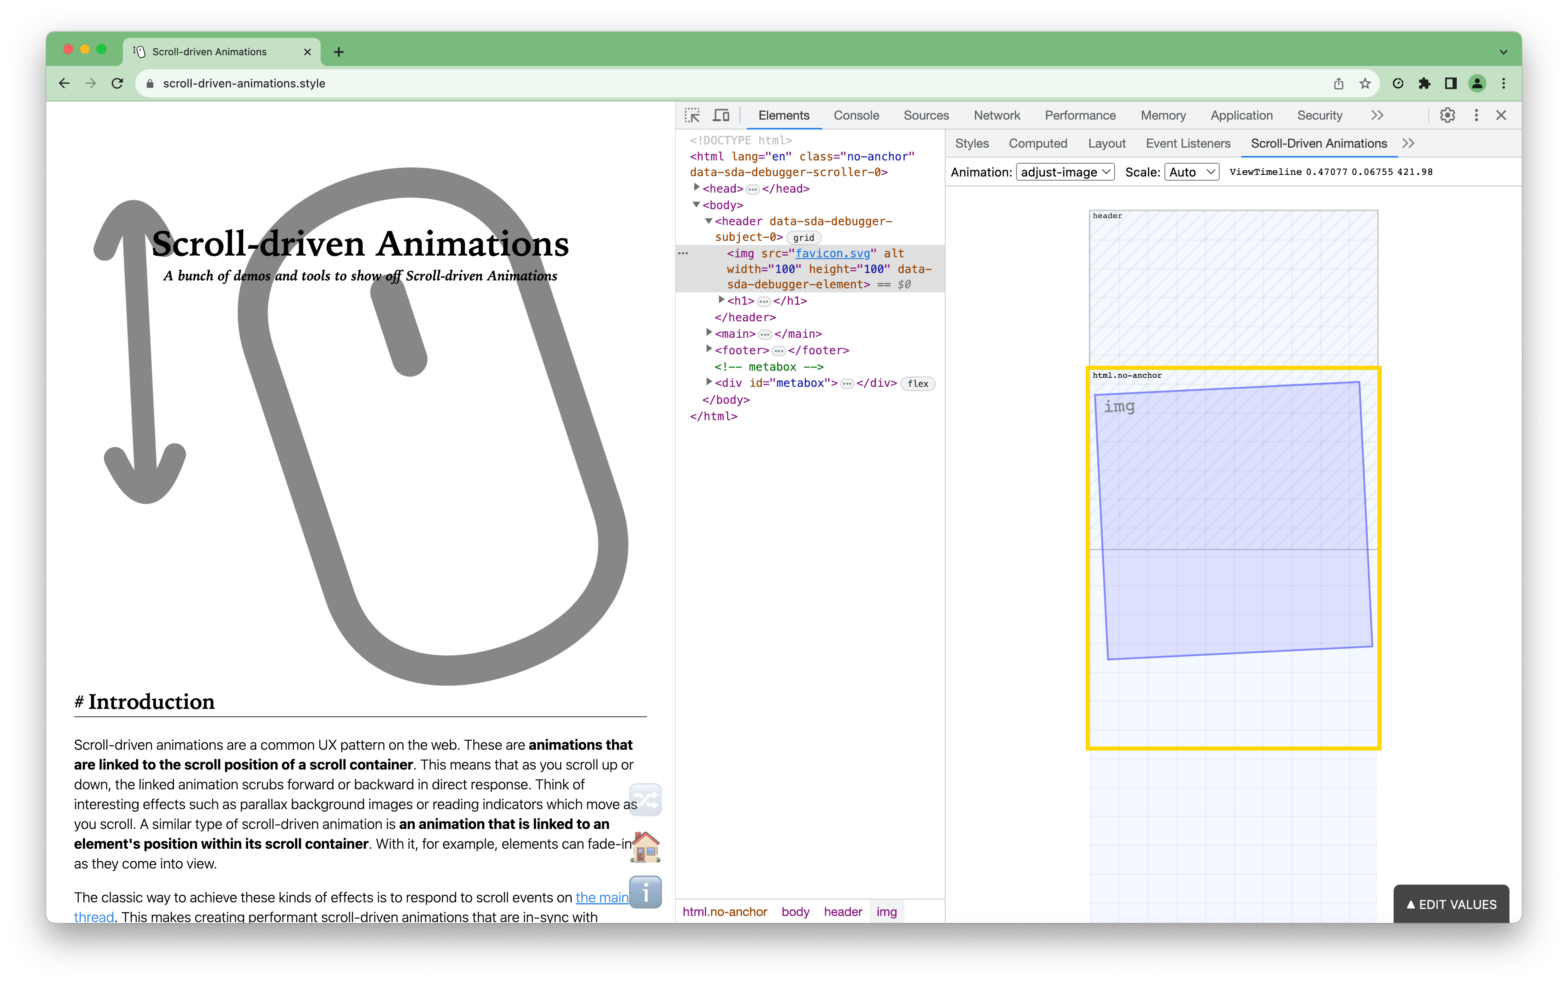
A DevTools extension to visualize and debug Scroll-Driven Animations
A rather geeky/technical weblog, est. 2001, by Bramus
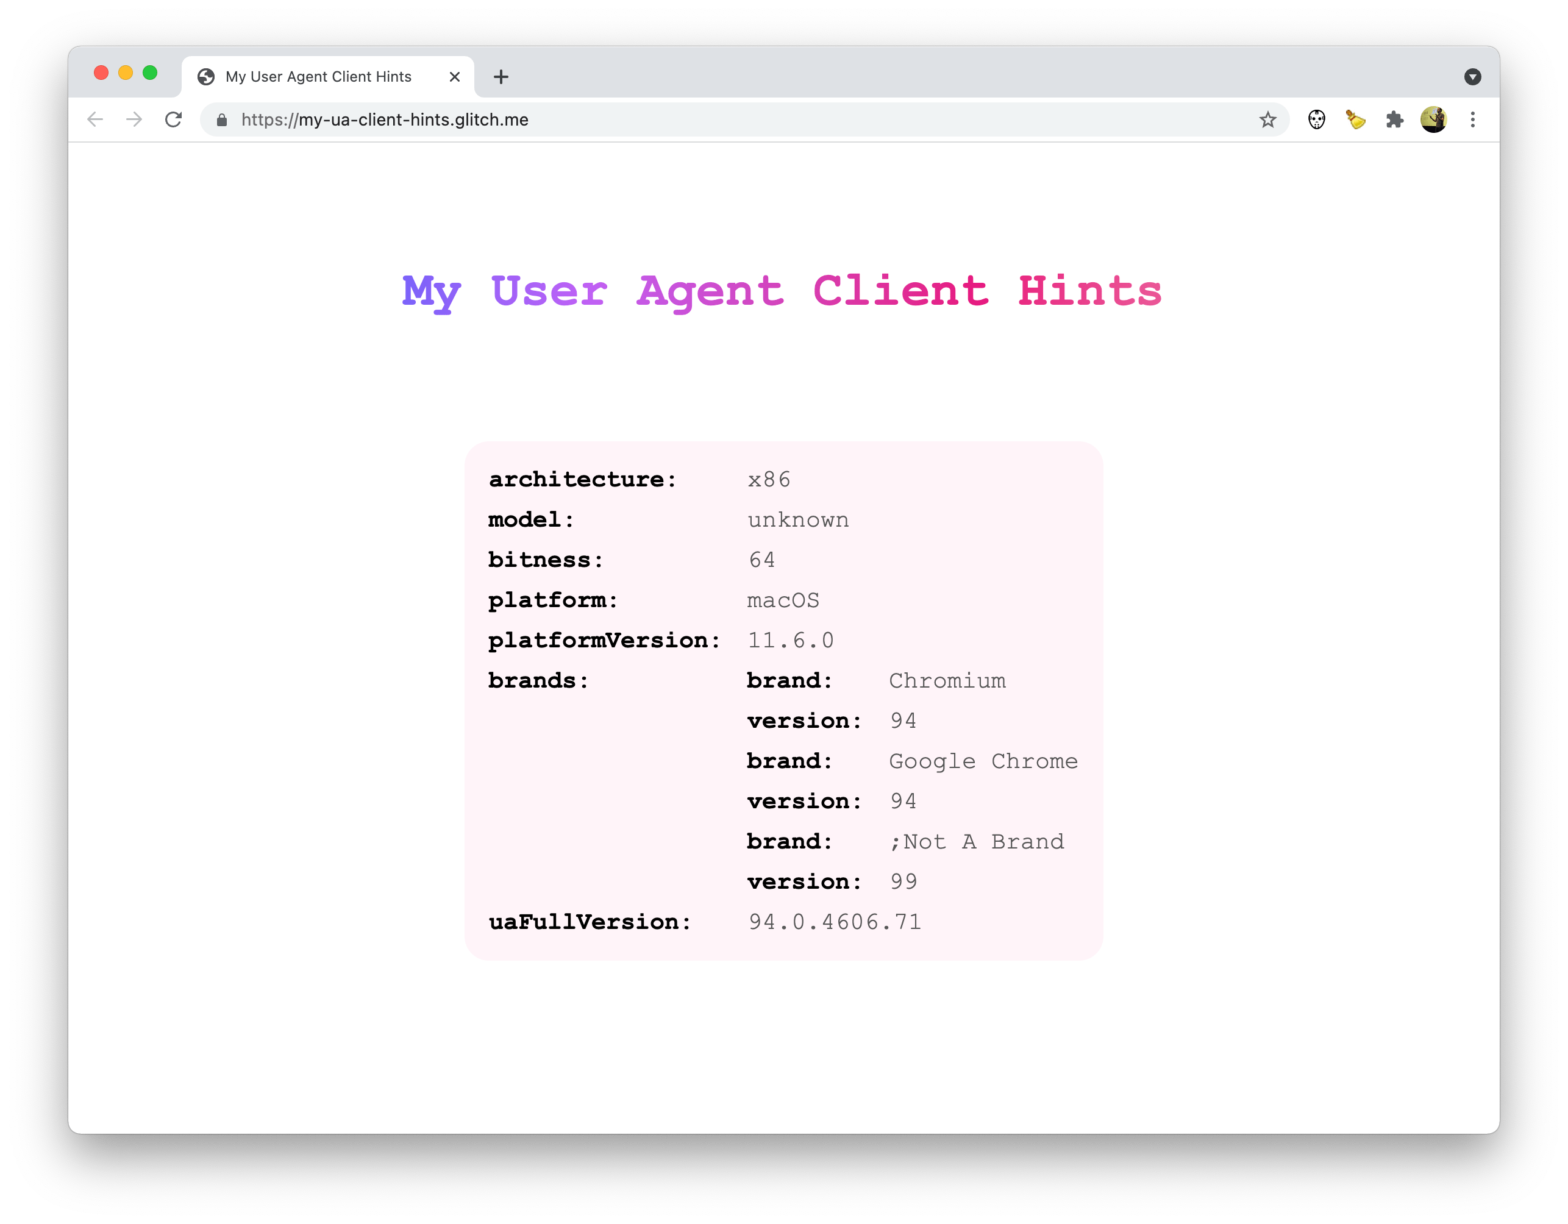
Patrick Brosset created a handy website that dumps the UA Client Hints your browser sends. Might come in handy. My User Agent Client Hints → Over at web.dev you can find an article that introduces User-Agent Client Hints
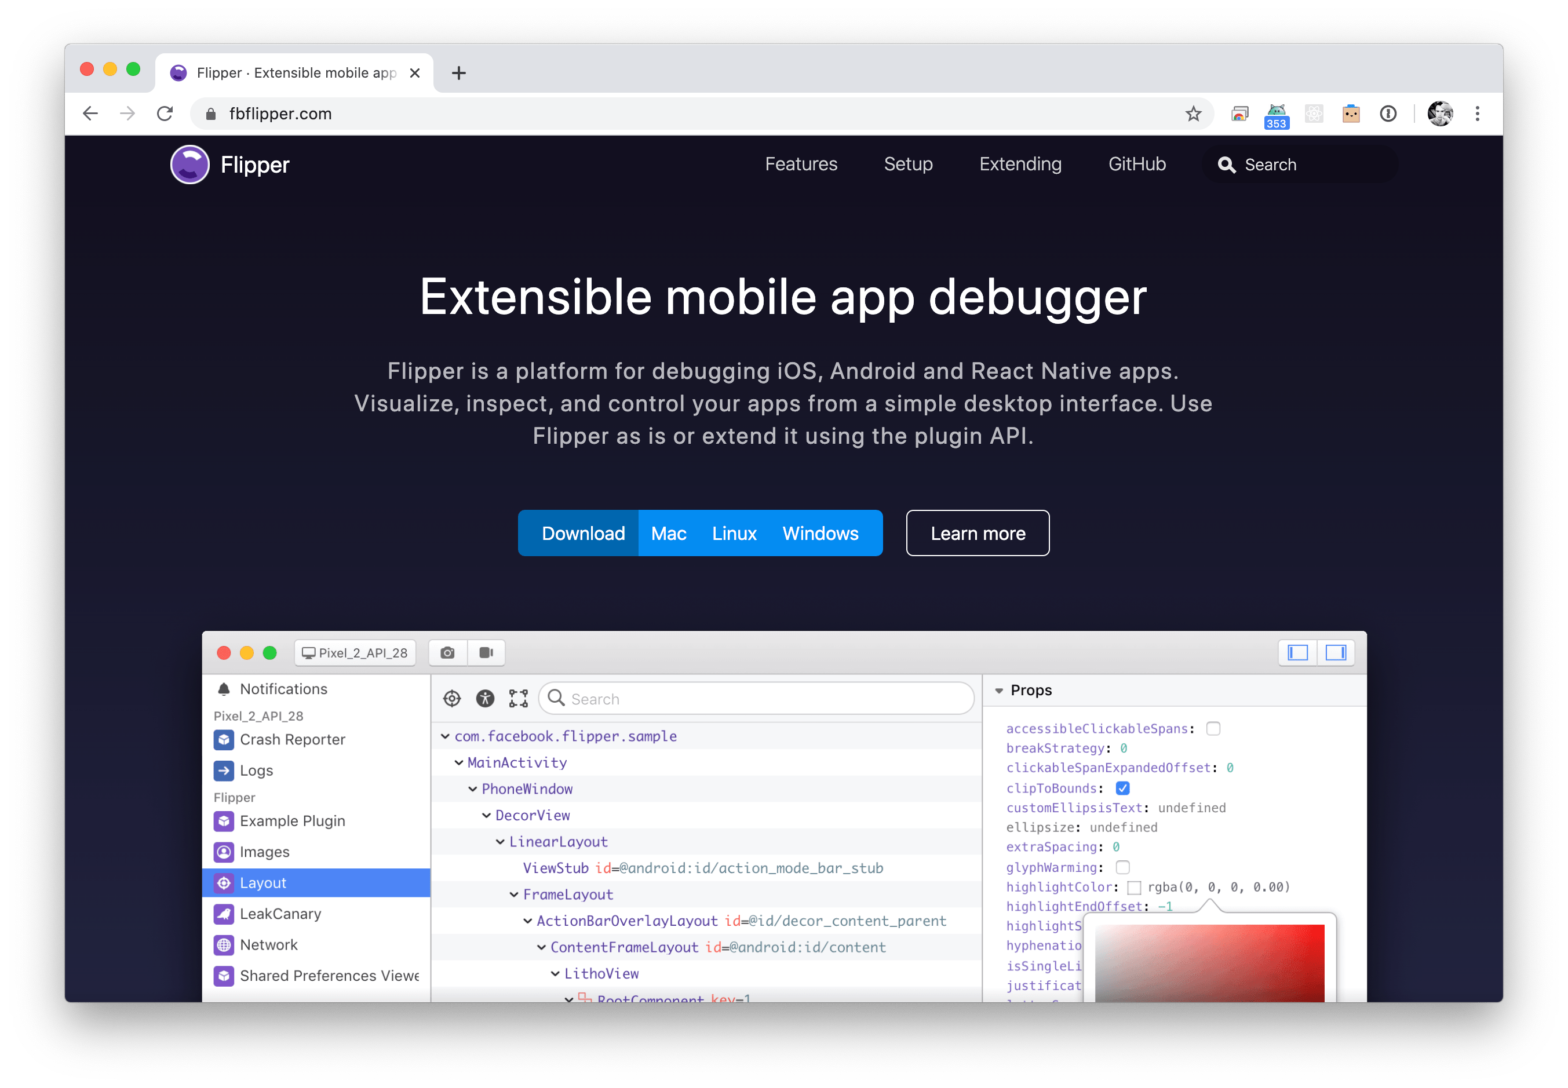
In this post Andréas Hanss gives us a tour on Flipper. Flipper is a platform for debugging iOS, Android and React Native apps. Visualize, inspect, and control your apps from a simple desktop interface. To add flipper support to your React Native project, I recommend the “Add Flipper Support” section from the Upgrade to React …
The React Native bridge is the hub where communication between the Javascript and the Native world happen. Optimizing and catching unexpected (bad) communications can make or break your performance. Being that central and sensitive place, it made sense to have tooling built around it. Snoopy is a profiling tool for React Native, that lets you …
Continue reading “React Native Snoopy, a profiling tool for React Native”
I had a bug in a React Native app which only occurred on the very first launch of the app, right after install. The bug was situated in a complex Redux Saga which bootstraps the application and populates the Redux store with things like an (anonymous) API token, (remote) config settings, etc. The bug didn’t …
Continue reading “Launch a React Native app with “Debug JS Remotely” enabled by default”
Spark Inspector will offer you an entirely new debugging perspective. With a three-dimensional view of your app’s interface and the ability to change view properties at runtime, Spark can help you craft the best apps on earth. Wiring your app together with notifications? Spark’s notification monitor shows you each NSNotification as it’s sent, complete with …
Continue reading “Spark Inspector – Runtime Inspection for iOS Apps”
A lot of editors are scriptable in Python. And Firefox has remote capabilities. So we are building a python library that can be used by editors to interact with Firefox (desktop or mobile). We could for example add JS breakpoints from Vim, or edit the code of the current page from SublimeText. Note that the …
Speed Tracer is a tool to help you identify and fix performance problems in your web applications. It visualizes metrics that are taken from low level instrumentation points inside of the browser and analyzes them as your application runs. Speed Tracer is available as a Chrome extension and works on all platforms where extensions are …