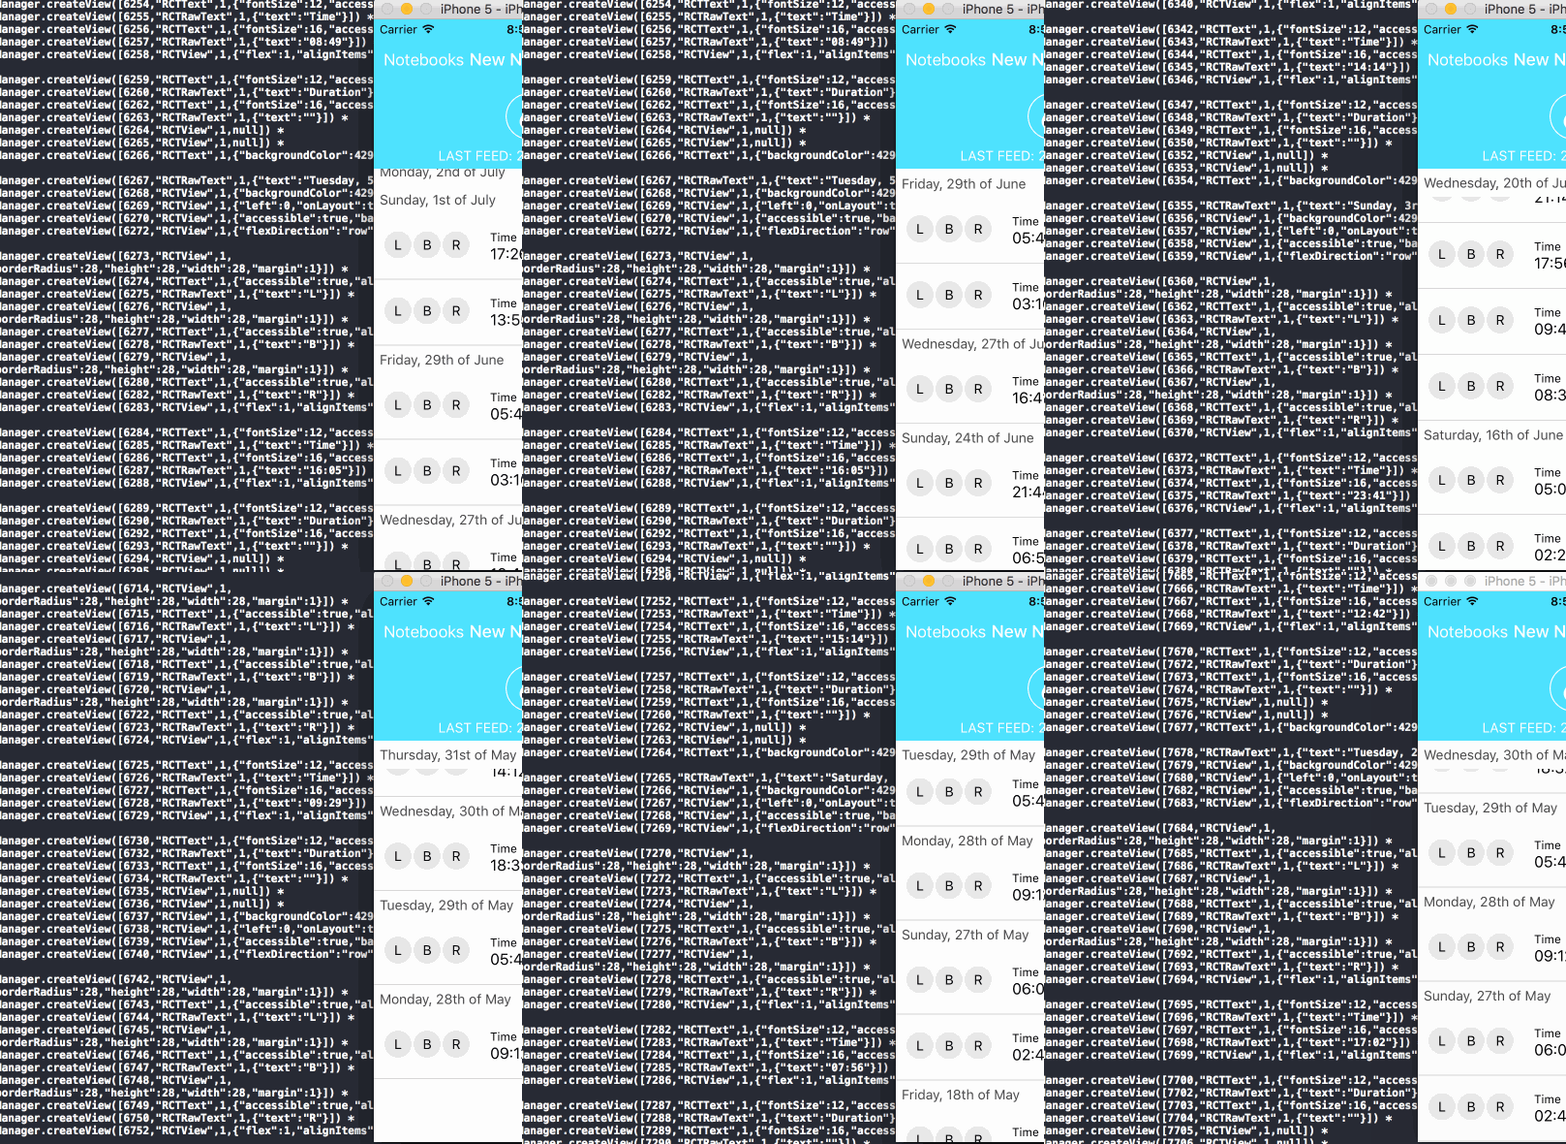
The React Native bridge is the hub where communication between the Javascript and the Native world happen. Optimizing and catching unexpected (bad) communications can make or break your performance. Being that central and sensitive place, it made sense to have tooling built around it.
Snoopy is a profiling tool for React Native, that lets you snoop on the React Native Bridge using the MessageQueue spy feature. With Snoopy you can tame a stream of events, using Rx and a few built-in goodies, to locate performance hogs, problems, and expose unexpected communications on the bridge.
// Snoopy
import Snoopy from 'rn-snoopy';
import filter from 'rn-snoopy/stream/filter';

import EventEmitter from 'react-native/Libraries/vendor/emitter/EventEmitter';

if (__DEV__) {
    const emitter = new EventEmitter();
    const events = Snoopy.stream(emitter);

    // Show calls to createView. Filter based on method, and provide a shape to match it.
    filter({ method: 'createView' }, true)(events).subscribe();
}
Next to watching all messages you filter them on type (as shown above), create charts with bars, etc.
Debug messages can be seen fly by using React Native Debugger or adb logcat | grep ReactNative or …
React Native Snoopy →
Debugging React Native Performance: Snoopy and the MessageQueue →
Leave a comment