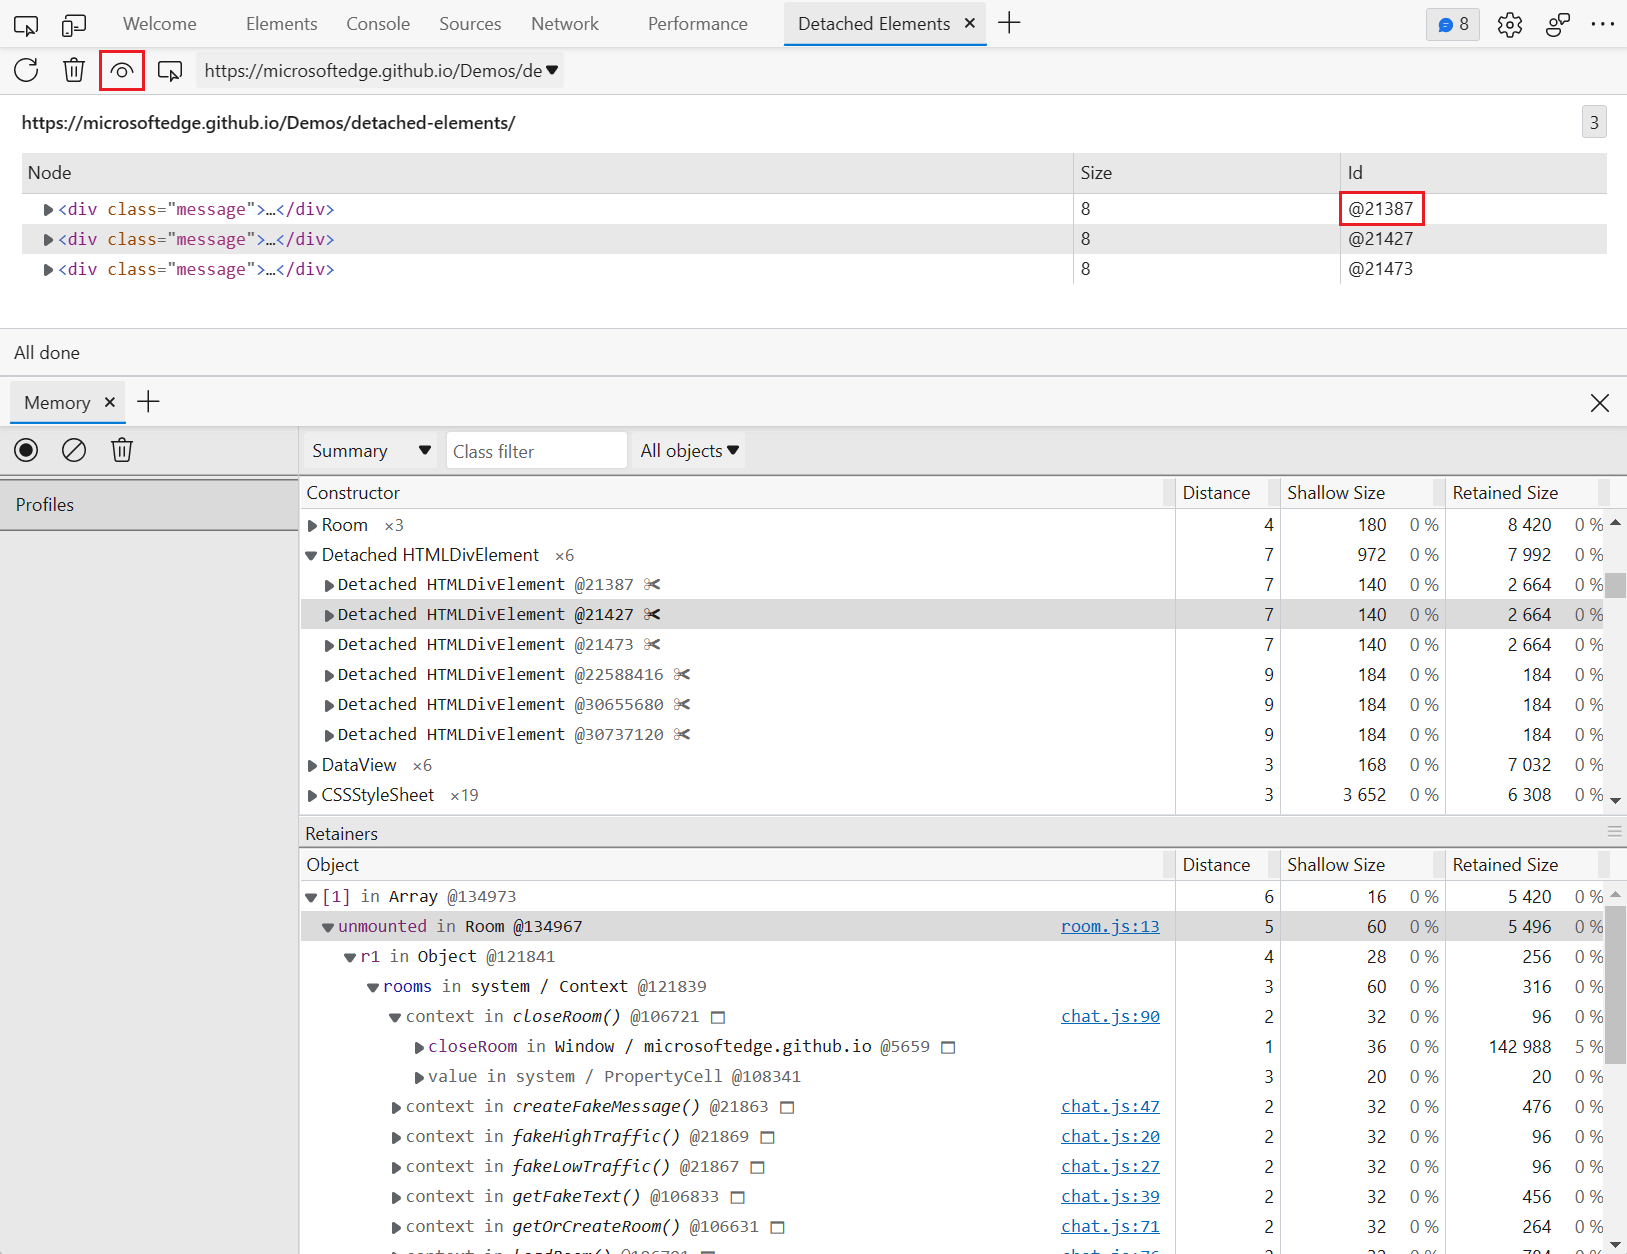
An experimental feature in the DevTools of Microsoft Edge Canary is the “Detached Elements” tool.
The “Detached Elements” tool allows you to find all nodes that are no longer attached to the document — a typical cause for leaking memory when you forget to clean them up.
There are valid reasons for detaching elements from the tree. An application might want to remove an element from the view but re-attach it later or in a different place. For example, Twitter detaches and re-attaches tweets as you scroll through the feed.
A DOM memory leak occurs when an application keeps references to more and more of these detached elements, without actually reusing them later.
This is particularly a problem for long running applications. Imagine an email client that detaches DOM elements every time an email is opened and closed. If the user keeps the app running for a whole week, this could amount to a really high memory usage which can slow down the entire device over time, especially as the detached elements may carry a lot of data with them.
Debug memory leaks with the Microsoft Edge Detached Elements tool →