This website is designed to help you understand some basic git concepts visually. This one would’ve come in handy back when I was teaching my students Git, in addition to the slides I used back then (2014). Visualizing Git Concepts with D3 →
A rather geeky/technical weblog, est. 2001, by Bramus
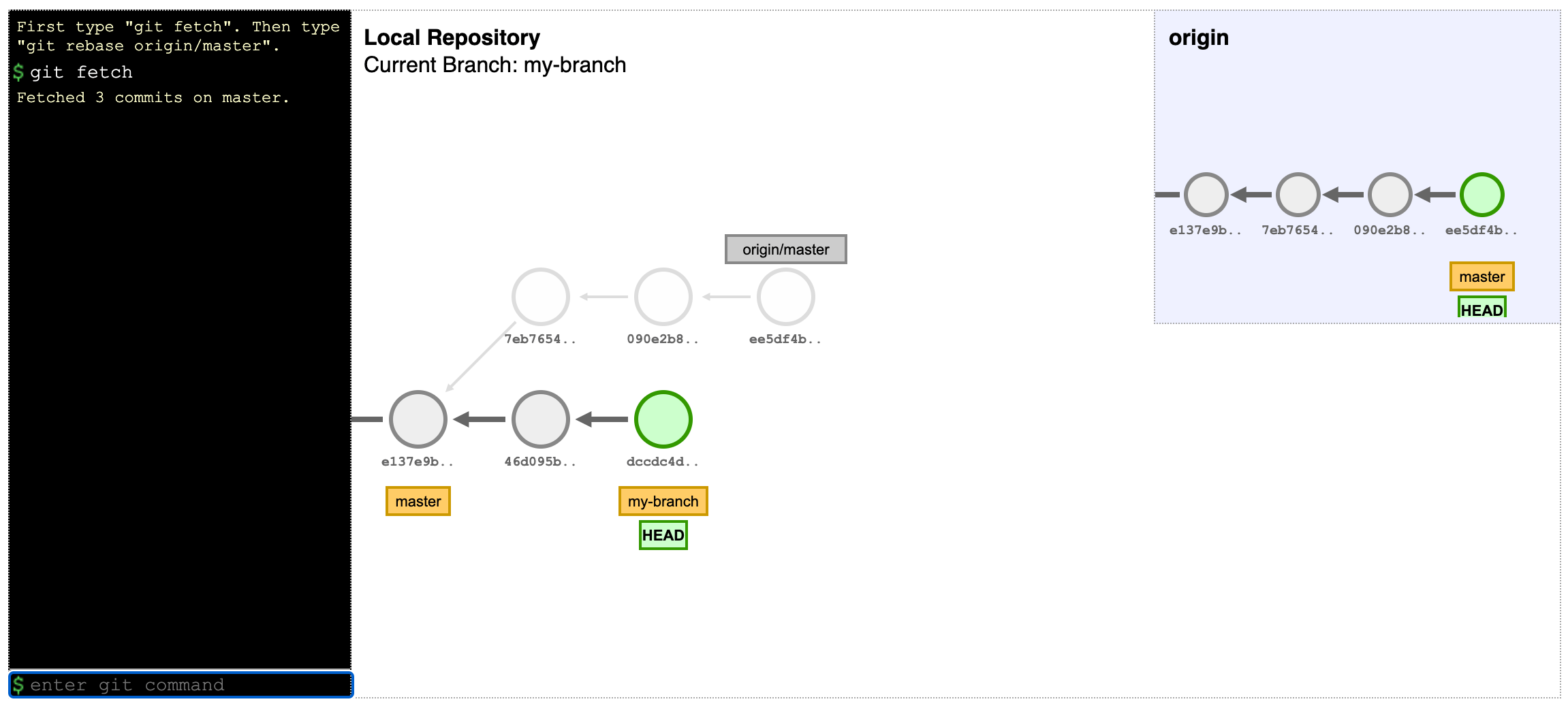
This website is designed to help you understand some basic git concepts visually. This one would’ve come in handy back when I was teaching my students Git, in addition to the slides I used back then (2014). Visualizing Git Concepts with D3 →
react-simple-mapsreact-simple-maps is a library of React components to make SVG maps using d3-geo and topojson. react-simple-maps → Whilst looking further I’ve stumbled upon these two Medium posts detailing an implementation: How to create pure react SVG maps with topojson and d3-geo → Mapping Tutorial: Combining Victory Charts and React-Simple-Maps →
D3 in Depth has dedicated a chapter to rendering geographic information. D3’s approach differs to so called raster methods such as Leaflet and Google Maps. Typically D3 requests vector geographic information in the form of GeoJSON and renders this to SVG or Canvas in the browser. D3 in Depth: Rendering Geographic Information →
Textures are useful for the selective perception of different categories var svg = d3.select(“#example”) .append(“svg”); var t = textures.lines() .thicker(); svg.call(t); svg.append(“circle”) .style(“fill”, t.url()); A multitude of predefined styles is available. It’s also possible to define your own styles. Textures.js →
The aim of dimple is to open up the power and flexibility of d3 to analysts. It aims to give a gentle learning curve and minimal code to achieve something productive. It also exposes the d3 objects so you can pick them up and run to create some really cool stuff. dimple → dimple Examples …
Continue reading “dimple – A simple charting API for d3 data visualisations”
Why are we so confident these are the most detailed maps you’ll ever see from the 2014 Senate elections? Precincts are the smallest level of geography for publicly-reported election results. There were more than 175,000 precincts in the United States in 2012, fifty times the number of counties. The maps here show precinct-level results, where …
MetricsGraphics.js is a library built on top of D3 that is optimized for visualizing and laying out time-series data. It provides a simple way to produce common types of graphics in a principled, consistent and responsive way. The library currently supports line charts, scatterplots and histograms as well as features like rug plots and basic …