MetricsGraphics.js

metricsgraphics

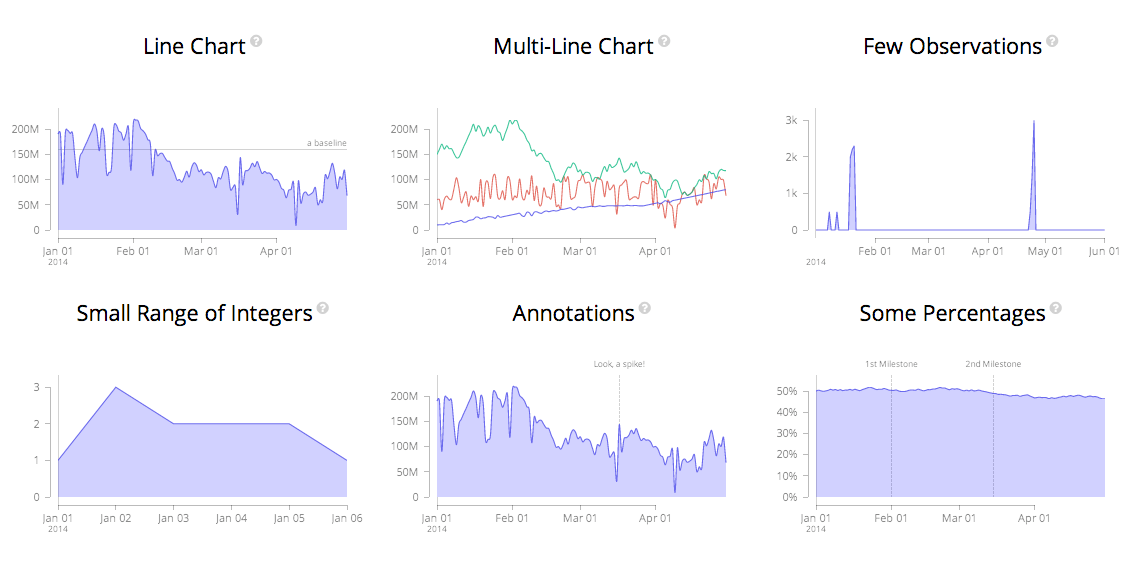
MetricsGraphics.js is a library built on top of D3 that is optimized for visualizing and laying out time-series data. It provides a simple way to produce common types of graphics in a principled, consistent and responsive way. The library currently supports line charts, scatterplots and histograms as well as features like rug plots and basic linear regression.

MetricsGraphics.js →

Published by Bramus!

Bramus is a frontend web developer from Belgium, working as a Chrome Developer Relations Engineer at Google. From the moment he discovered view-source at the age of 14 (way back in 1997), he fell in love with the web and has been tinkering with it ever since (more …)

Leave a comment

Your email address will not be published. Required fields are marked *

This site uses Akismet to reduce spam. Learn how your comment data is processed.