Chart Design Guidelines at City Intelligence

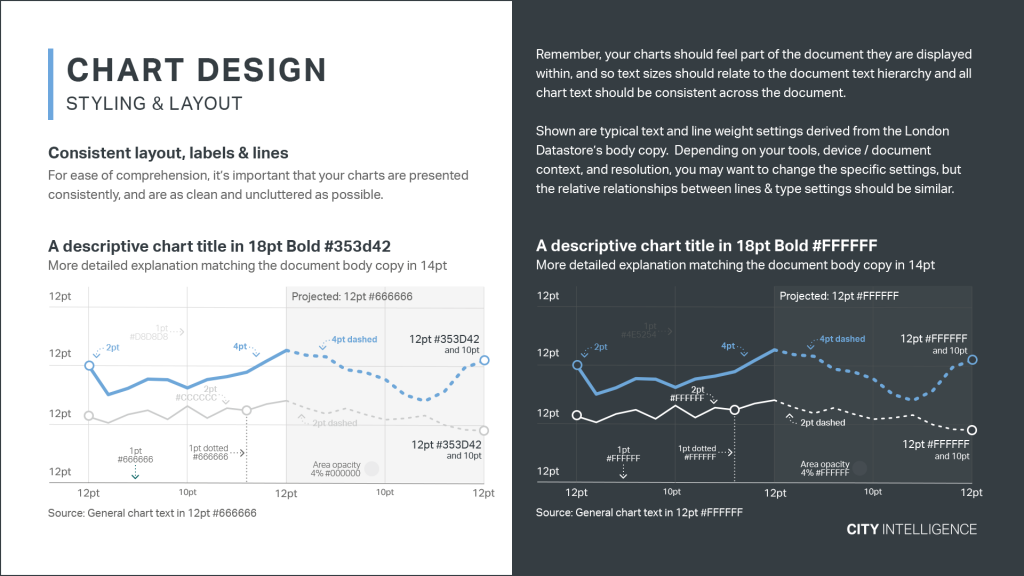
At the City Intelligence unit at City Hall almost anyone can create a data visualisation. To keep everyone in line they created Data Design Guidelines: Effective communication of evidence and data through information design and data visualisation, is obviously important to help inform policy internally, but it is also just as important to help boroughs …

Frappé Charts

GitHub-inspired simple and modern charts for the web with zero dependencies. The typical Github monthly activity map is also possible: import Chart from ‘frappe-charts/dist/frappe-charts.min.esm’; const heatmap = new Chart({ parent: “#heatmap”, type: ‘heatmap’, height: 115, data: heatmap_data, // object with date/timestamp-value pairs start: start_date, // A Date object (default: today’s date in past year) legend_colors: …

dimple – A simple charting API for d3 data visualisations

The aim of dimple is to open up the power and flexibility of d3 to analysts. It aims to give a gentle learning curve and minimal code to achieve something productive. It also exposes the d3 objects so you can pick them up and run to create some really cool stuff. dimple → dimple Examples …

MetricsGraphics.js

MetricsGraphics.js is a library built on top of D3 that is optimized for visualizing and laying out time-series data. It provides a simple way to produce common types of graphics in a principled, consistent and responsive way. The library currently supports line charts, scatterplots and histograms as well as features like rug plots and basic …

Chartist – Simple responsive charts

/* Add a basic data series with six labels and values */ var data = { labels: [‘1’, ‘2’, ‘3’, ‘4’, ‘5’, ‘6’], series: [{ data: [1, 2, 3, 5, 8, 13] }] }; /* Set some base options (settings will override the default settings in Chartist.js *see default settings*). We are adding a basic …

SketchInsight

SketchInsight is an interactive whiteboard system for storytelling with data by using real-time sketching. Creating personalized, expressive data charts becomes quick and easy. The presenter simply sketches an example, and SketchInsight automatically completes the chart by synthesizing from example sketches. SketchInsight: Natural Data Exploration and Presentation through Sketch-based Interaction → (via teusje)