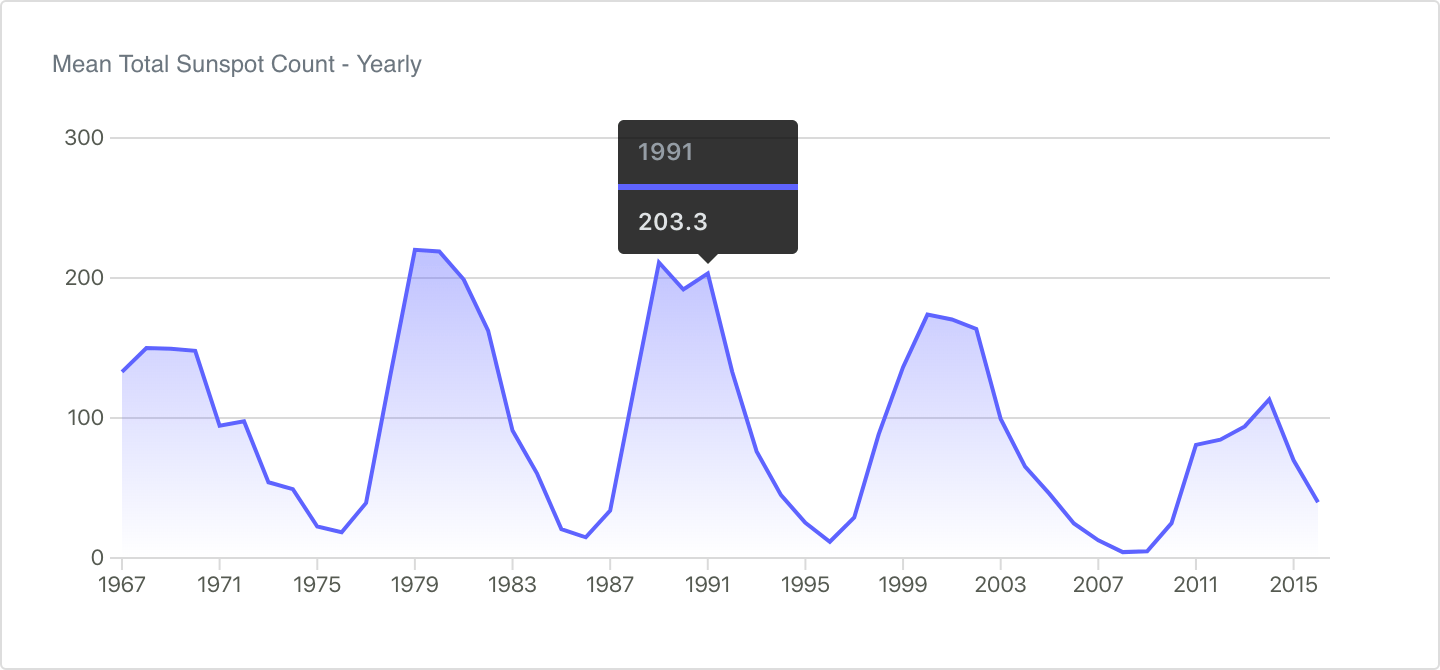
GitHub-inspired simple and modern charts for the web with zero dependencies.
The typical Github monthly activity map is also possible:

import Chart from 'frappe-charts/dist/frappe-charts.min.esm';

const heatmap = new Chart({
    parent: "#heatmap",
    type: 'heatmap',
    height: 115,
    data: heatmap_data, // object with date/timestamp-value pairs
    start: start_date, // A Date object (default: today's date in past year)
    legend_colors: ['#ebedf0', '#c6e48b', '#7bc96f', '#239a3b', '#196127'], // Set of five incremental colors
});
Leave a comment