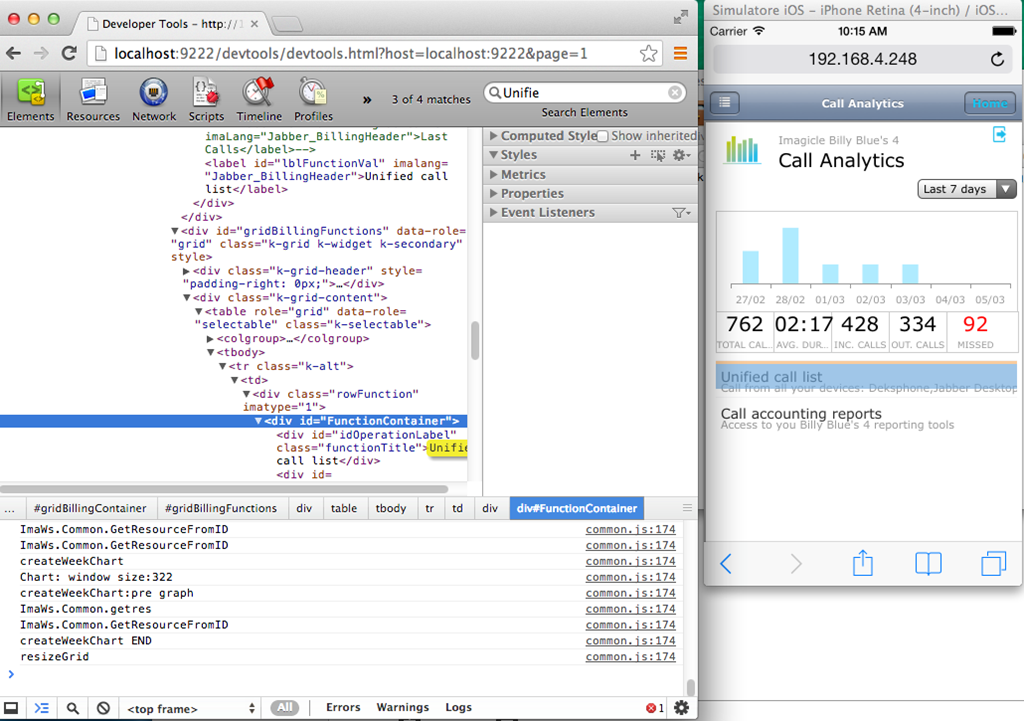
The ios_webkit_debug_proxy allows developers to inspect MobileSafari and UIWebViews on real and simulated iOS devices via the DevTools UI and WebKit Remote Debugging Protocol. DevTools requests are translated into Apple’s Remote Web Inspector service calls.
The proxy detects when iOS devices are attached/removed and provides the current device list on http://localhost:9221. A developer can click on a device’s link (e.g. http://localhost:9222) to list that device’s open tabs, then click on a tab link (e.g. http://localhost:9222/devtools/page/1) to inspect that tab in their browser’s DevTools UI.
iOS WebKit Debug Proxy →
How to investigate IOS Safari crashes using Chrome →