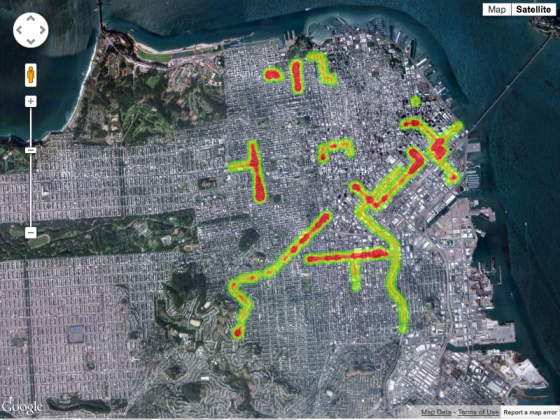
Some time last week, Google has (finally) released a HeatMap Layer for Google Maps.

The Heatmap Layer provides client side rendering of heatmaps. A heatmap is a visualization used to depict intensity of data at geographical points. When the Heatmap Layer is enabled, a colored overlay will appear on top of the map. By default, areas of higher intensity will be colored red, and areas of lower intensity will appear green.
Supports custom color themes, and allows to have weighted points. Usage is really simple: just pass in an array of LatLngs and you’re done
/* Data points defined as an array of LatLng objects */
var heatmapData = [
  new google.maps.LatLng(37.782, -122.447),
  new google.maps.LatLng(37.782, -122.445),
  new google.maps.LatLng(37.782, -122.443),
  new google.maps.LatLng(37.782, -122.441),
  new google.maps.LatLng(37.782, -122.439),
  new google.maps.LatLng(37.782, -122.437),
  new google.maps.LatLng(37.782, -122.435),
  new google.maps.LatLng(37.785, -122.447),
  new google.maps.LatLng(37.785, -122.445),
  new google.maps.LatLng(37.785, -122.443),
  new google.maps.LatLng(37.785, -122.441),
  new google.maps.LatLng(37.785, -122.439),
  new google.maps.LatLng(37.785, -122.437),
  new google.maps.LatLng(37.785, -122.435)
];

var sanFrancisco = new google.maps.LatLng(37.774546, -122.433523);

map = new google.maps.Map(document.getElementById('map_canvas'), {
  center: sanFrancisco,
  zoom: 13,
  mapTypeId: google.maps.MapTypeId.SATELLITE
});

var heatmap = new google.maps.visualization.HeatmapLayer({
  data: heatmapData
});
heatmap.setMap(map);
nice! done with custom low heatmaps 🙂