The Specificity Graph is a very simple model for diagrammatically assessing the overall health of your codebase in terms of specificity—a way of looking at an entire project’s CSS and highlighting any potentially troublesome areas of higher-than-ideal specificity. We can then use this snapshot to refactor and rearchitect old projects into a better shape, or to ensure we’re writing new projects in a sustainable manner.
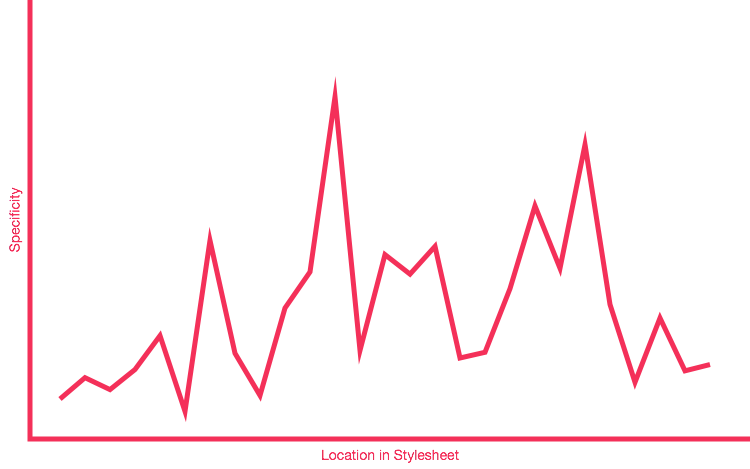
A graph with a lot of peaks and troughs is a bad Specificity Graph: it is telling us that our CSS is full of—or prone to—specificity issues because of weighty selectors being defined before lighter ones.
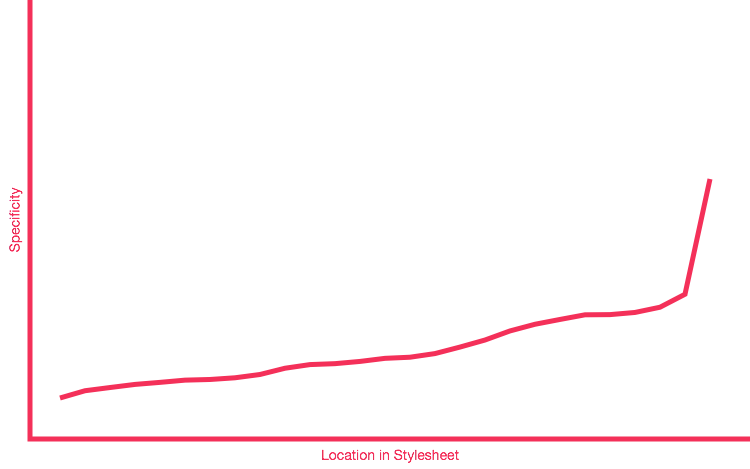
After refactoring, a specificity graph should ideally look like so:
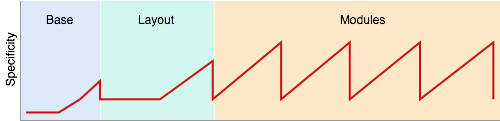
When using SMACCS, a graph would ideally look like this:
Leave a comment