Coming to the next version of ArcGIS is the “Spilhaus projection”:
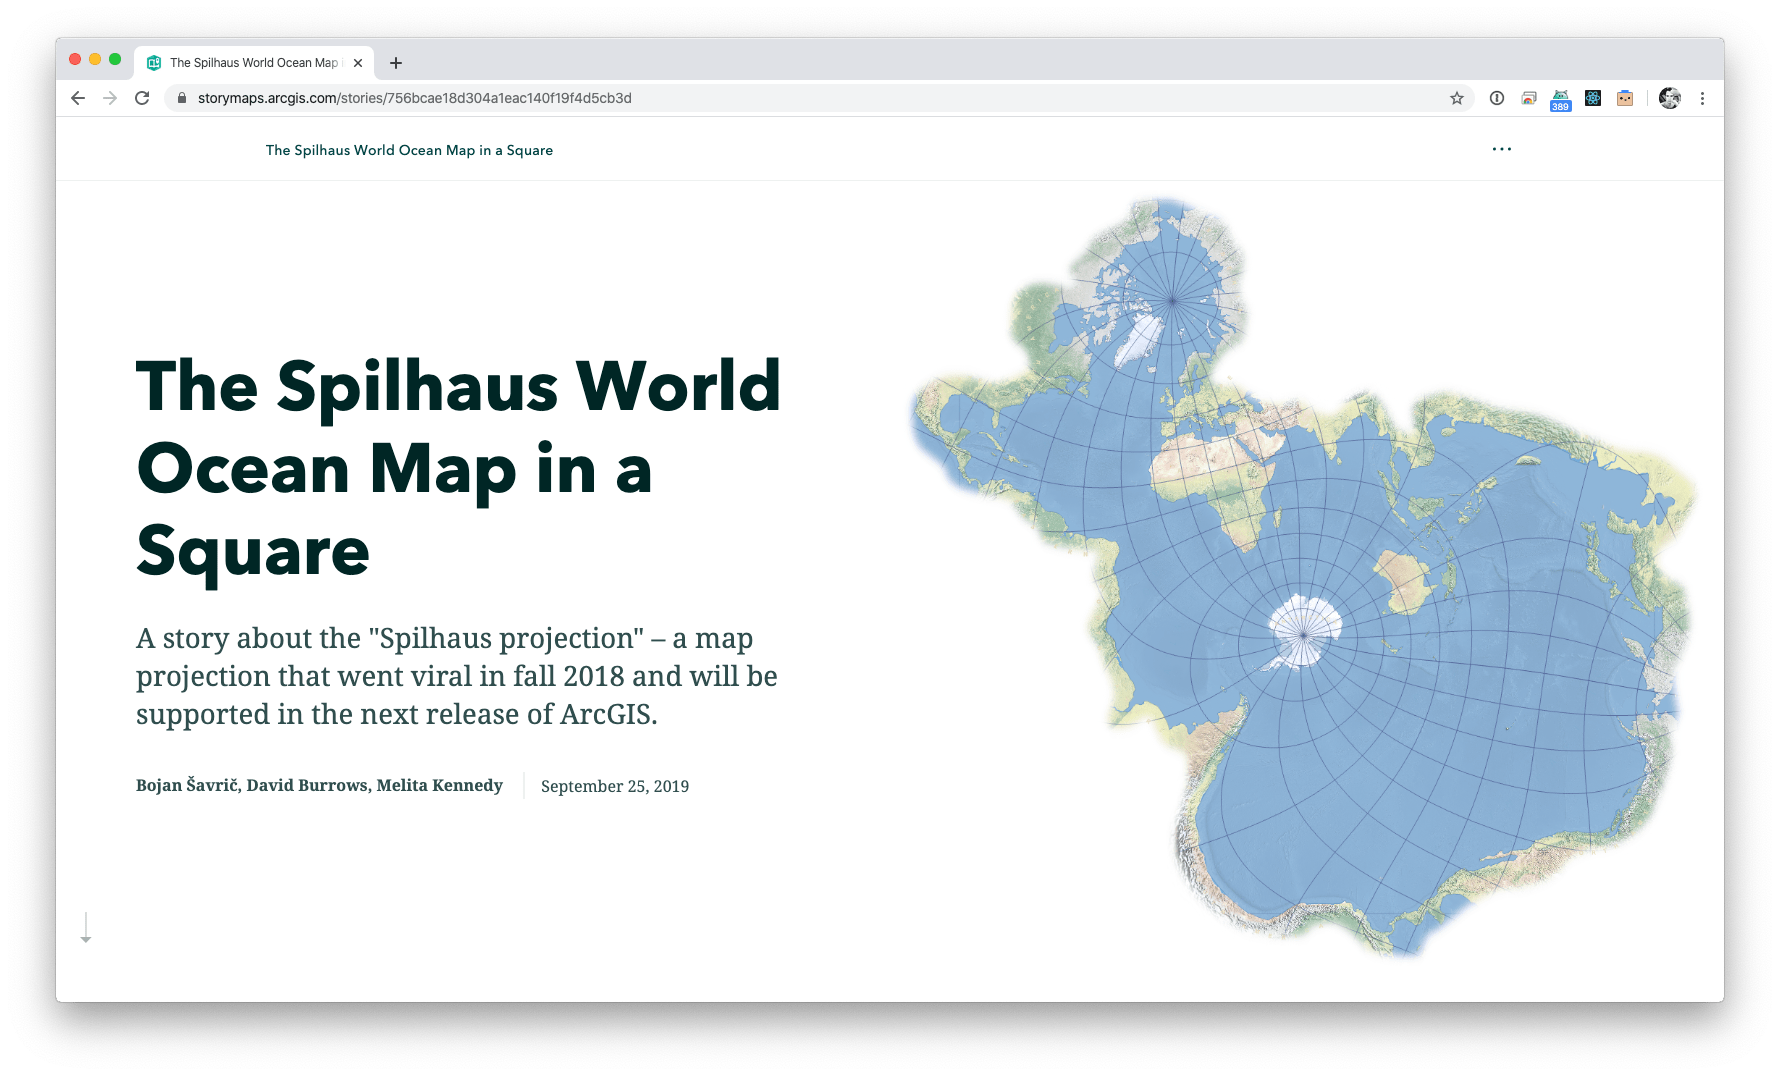
In September and October of 2018, three maps went viral on social media and the web. All of them had the same perspective, featured oceans as the main focus, and presented the oceans as one body of water. The maps were based on the so-called “Spilhaus projection” and centered on Antarctica. Though it has recently gained some popularity online, this projection is not new. Many articles recognize Athelstan F. Spilhaus, a South African-American geophysicist and oceanographer, as the author of this projection back in 1942.
Over at the ArcGIS blog they outline the history and how they’ve implemented it in their next version (ArcGIS Pro 2.5 / ArcGIS 10.8).