The idea of visualizing data is old: After all, that’s what a map is—a representation of geographic information—and we’ve had maps for about 8,000 years. But it was rare to graph anything other than geography. Only a few examples exist: Around the 11th century, a now-anonymous scribe created a chart of how the planets moved through the sky. By the 18th century, scientists were warming to the idea of arranging knowledge visually.
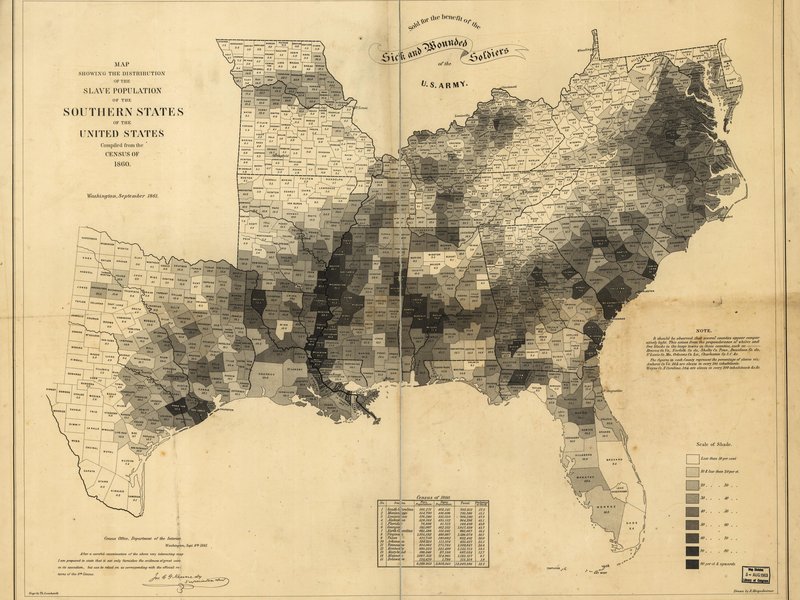
Still, data visualization was rare because data was rare. That began to change rapidly in the early 19th century, because countries began to collect—and publish—reams of information about their weather, economic activity and population. “For the first time, you could deal with important social issues with hard facts, if you could find a way to analyze it,” says Michael Friendly, a professor of psychology at York University who studies the history of data visualization. “The age of data really began.”